Ag stats: Colorado crop progress and condition report – week ending June 9, 2024
Above average temperatures and stormy conditions were experienced across the State, according to the Mountain Regional Field Office of the National Agricultural Statistics Service, USDA.
According to the U.S. Drought Monitor for June 4, drought conditions were present across almost 13 percent of the State, down from 16 percent last week. Abnormally dry conditions accounted for more than 25 percent of the State. Moderate drought conditions moved into portions of northern Larimer and Weld counties. Conditions improved in areas of Cheyenne and Kiowa Counties, and most of the area was downgraded to abnormally dry. Severe drought conditions in Baca and Prowers Counties remained unchanged, with less than 1 percent of the State rated in the category.
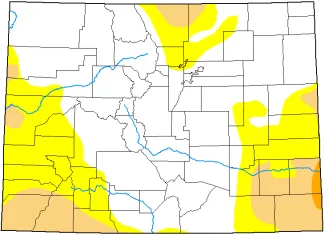
Map of Colorado drought conditions as of June 4, 2024 - National Drought Mitigation Center
Many areas within northeast received at least half an inch of moisture, with isolated areas in Douglas, Kit Carson and Morgan Counties getting more than 2 inches. Severe storms brought heavy rain, damaging wind, and large hail across the eastern plains. The largest hail was reported in Kit CarsonCounty, while wind gusts in Arapahoe County reached over 70 miles per hour. Reports on hail damage from eastern counties on crops and rangeland were received, although the extent of the damage is yet to be determined.
Many southeastern counties received moisture last week. Isolated areas in Las Animas, Otero, and Pueblo Counties received upwards of 3 inches ofmoisture. A high level of abandonment was expected for the winter wheat crop in the area.
The San Luis Valley had areas that received around 1 inch of moisture, but most of the district remained dry. Potato planting was almost complete, and emergence moved quickly. Range and pastures were in good condition, and livestock were doing well.
Alfalfa harvest progress jumped above the 5-year average last week, with 35 percent of the crop harvested by week’s end. Emergence of the barley crop was almost complete, with 98 percent of the crop emerged.
Planting of the corn crop was wrapping up, with 96 percent of the intended acres reported as planted, and 64 percent of the crop emerged.
Dry edible bean planting continued behind the average, with 42 percent of the crop planted.
Potato planting was in the final stages, with 95 percent of acres planted across the State. Planting of the proso millet crop fell behind the average and previous year, with 42 percent of the crop planted.
The sunflower crop was reported as 42 percent planted, behind the previous year of 50 percent and the 5-year average of 45 percent.
Stored feed supplies were reported as 1 percent very short, 4 percent short, 89 percent adequate, and 6 percent surplus.
Cattle death loss was reported as 1 percent heavy, 39 percent average, and 60 percent light.
Sheep death loss was reported as 90 percent average and 10 percent light.
CROP AND LIVESTOCK PROGRESS | ||||
Commodity | Current week | Previous week | Previous year | 5-year average |
| Alfalfa | (percent) | (percent) | (percent) | (percent) |
| 1st cutting harvested . | 35 | 12 | 24 | 34 |
| Barley | ||||
| Emerged. | 98 | 90 | 84 | 95 |
| Headed. | 1 | NA | 2 | 1 |
| Corn | ||||
| Planted . | 96 | 86 | 96 | 95 |
| Emerged. | 64 | 47 | 66 | 77 |
| Dry edible beans | ||||
| Planted . | 42 | 25 | 61 | 45 |
| Emerged. | 15 | 5 | 27 | 15 |
| Potatoes inside San Luis Valley | ||||
| Planted . | 95 | 92 | NA | NA |
| Emerged. | 52 | 36 | 21 | 43 |
| Potatoes outside San Luis Valley | ||||
| Planted . | 95 | 85 | 80 | 95 |
| Emerged. | 47 | 35 | 55 | 77 |
| Proso millet | ||||
| Planted . | 42 | 34 | 44 | 49 |
| Sorghum | ||||
| Planted . | 49 | 32 | 44 | 51 |
| Emerged. | 15 | -- | 16 | 17 |
| Sugarbeets | ||||
| Emerged. | 95 | 80 | 85 | 92 |
| Sunflowers | ||||
| Planted . | 42 | 27 | 50 | 45 |
| Winter wheat | ||||
| Headed. | 77 | 64 | 77 | 83 |
| Coloring. | 22 | 13 | 5 | 9 |
NA – not available (--) – zero
| DAYS SUITABLE FOR FIELDWORK AND SOIL MOISTURE CONDITION | ||||
| Current week | Previous week | Previous year | 5-year average | |
| Days suitable for fieldwork. | 6.3 | 5.7 | 5.0 | 5.8 |
| Topsoil moisture | (percent) | (percent) | (percent) | (percent) |
| Very short . | 2 | 8 | 2 | 10 |
| Short . | 24 | 25 | 5 | 24 |
| Adequate . | 66 | 56 | 83 | 63 |
| Surplus . | 8 | 11 | 10 | 3 |
| Subsoil moisture | ||||
| Very short . | 3 | 6 | 6 | 15 |
| Short . | 27 | 24 | 19 | 29 |
| Adequate . | 63 | 63 | 69 | 54 |
| Surplus . | 7 | 7 | 6 | 2 |
NA – not available (--) – zero
CROP, LIVESTOCK, PASTURE AND RANGE CONDITION | ||||
Commodity | Current week | Previous week | Previous year | 5-year average |
| Alfalfa hay | (percent) | (percent) | (percent) | (percent) |
| Very poor. | 1 | -- | 2 | 5 |
| Poor . | 3 | 2 | 5 | 8 |
| Fair. | 11 | 13 | 23 | 24 |
| Good . | 64 | 60 | 61 | 52 |
| Excellent. | 21 | 25 | 9 | 11 |
| Barley | ||||
| Very poor. | 1 | 1 | -- | 1 |
| Poor . | 4 | 2 | -- | 5 |
| Fair. | 16 | 14 | 10 | 25 |
| Good . | 59 | 65 | 41 | 44 |
| Excellent. | 20 | 18 | 49 | 25 |
| Corn | ||||
| Very poor. | 3 | -- | -- | 1 |
| Poor . | 5 | 7 | 1 | 5 |
| Fair. | 22 | 30 | 17 | 33 |
| Good . | 63 | 57 | 64 | 50 |
| Excellent. | 7 | 6 | 18 | 11 |
| Onion | ||||
| Very poor. | -- | -- | -- | 1 |
| Poor . | 2 | 2 | -- | 1 |
| Fair. | 40 | 39 | 40 | 30 |
| Good . | 25 | 27 | 20 | 56 |
| Excellent. | 33 | 32 | 40 | 12 |
| Pasture and range | ||||
| Very poor. | 1 | 1 | 2 | 11 |
| Poor . | 12 | 12 | 5 | 12 |
| Fair. | 30 | 31 | 29 | 26 |
| Good . | 53 | 52 | 56 | 44 |
| Excellent. | 4 | 4 | 8 | 7 |
| Potatoes inside San Luis Valley | ||||
| Very poor. | -- | NA | NA | NA |
| Poor . | 5 | NA | NA | NA |
| Fair. | 25 | NA | NA | NA |
| Good . | 55 | NA | NA | NA |
| Excellent. | 15 | NA | NA | NA |
| Potatoes outside the San Luis Valley | ||||
| Very poor. | -- | NA | -- | 1 |
| Poor . | -- | NA | -- | 1 |
| Fair. | 15 | NA | -- | 17 |
| Good . | 85 | NA | 100 | 71 |
| Excellent. | -- | NA | -- | 10 |
| Sorghum | ||||
| Very poor. | 1 | NA | 1 | NA |
| Poor . | 5 | NA | 3 | NA |
| Fair. | 25 | NA | 31 | NA |
| Good . | 60 | NA | 60 | NA |
| Excellent. | 9 | NA | 5 | NA |
| Sugarbeets | ||||
| Very poor. | 1 | -- | -- | 1 |
| Poor . | 1 | 1 | -- | 2 |
| Fair. | 12 | 16 | 29 | 31 |
| Good . | 83 | 71 | 63 | 53 |
| Excellent. | 3 | 12 | 8 | 13 |
| Winter wheat | ||||
| Very poor. | 7 | 7 | 8 | 12 |
| Poor . | 16 | 17 | 14 | 14 |
| Fair. | 32 | 30 | 24 | 25 |
| Good . | 42 | 43 | 41 | 39 |
| Excellent. | 3 | 3 | 13 | 10 |
| Livestock | ||||
| Very poor. | -- | 1 | 1 | 1 |
| Poor . | 2 | 1 | 1 | 5 |
| Fair. | 6 | 13 | 22 | 19 |
| Good . | 85 | 78 | 53 | 60 |
| Excellent. | 7 | 7 | 23 | 15 |
NA – not available (--) – zero

