Ag stats – Colorado crop progress and condition report – week ending May 26, 2024
Cooler than average temperatures, scattered moisture, and windy conditions were experienced across the State, according to the MountainRegional Field Office of the National Agricultural Statistics Service, USDA.
According to the U.S. Drought Monitor released on May 23, drought conditions were present across more than 12 percent of the State, up from9 percent last week. Abnormally dry conditions across the State decreased almost 6 percentage points to just under 25 percent.
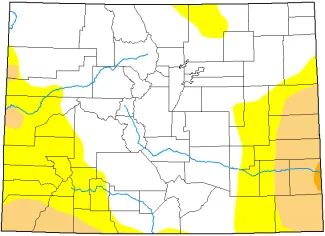
Map of Colorado drought conditions as of May 21, 2024 - National Drought Mitigation Center
Conditions improved within the San Luis Valley accounting for most of the decrease of abnormally dry conditions. Moderate droughtconditions moved into Kit Carson County.
Severe drought conditions in Prowers County were downgraded last week, with less than 1 percent of the State rated in the category.
Most northwestern counties experienced at least half an inch of moisture last week. Severe storms and lightning were present across the areaearly in the week.
Moisture was varied in northeastern counties last week. Areas of Logan, Phillips, Washington, and Yuma Counties received over two inches ofmoisture, while most other counties received at least half an inch. Far eastern counties were in the middle of a large storm cell early in the week,heavy rain and lightning were prevalent and baseball sized hail fell in Yuma. Cheyenne and Kiowa Counties received minimal moisture and reporters noted without rain soon, winter wheat conditions will deteriorate.
Conditions across the winter wheat growing area were varied, with the northeastern crop in good condition. The crop in the southeastern portionof the State was stressed due to lack of moisture. Southeastern counties received minimal moisture last week.
The San Luis Valley remained primarily dry last week, but reporters noted moisture that last few weeks had improved crop outlook. Planting ofthe potato crop made significant progress among dry conditions. Below freezing temperatures nipped some early emerging potatoes. Reportersnoted that livestock were in good condition, and the alfalfa crop had progressed well.
Southwestern counties received scattered moisture, with higher elevations receiving half an inch and other areas remaining dry.
Alfalfa harvest progressed minimally last week, with 4 percent of the crop harvested by week’s end.
Emergence of the barley crop continued, with 80 percent emerged, behind the 5-year average of 86 percent.
Planting of the corn crop progressed quickly last week, with 74 percent of the intended acres reported as planted, behind the 5-year average of 77 percent. Emergence of the corn crop fell behind the 5-year average, with 37 percent of the crop having emerged by week’s end.
Dry edible bean planting is off to a slow start compared to last year, with 11 percent of the crop planted.
Potato planting progressed quickly across the State last week, with 86 percent of acres planted in the San Luis Valley and 70 percent reportedplanted across the rest of the State, both still notably behind the average.
Planting of the onion and sugarbeet crop in northeastern counties continued, with 88 percent of onions and 98 percent of the sugarbeet crop planted.
The sunflower crop was reported as 19 percent planted, behind the previous year of 22 percent and ahead of the 5-year average of 15 percent.
Stored feed supplies were reported as 3 percent short, 82 percent adequate, and 15 percent surplus.
Cattle death loss was reported as 41 percent average and 59 percent light.
Sheep death loss was reported as 85 percent average and 15 percent light.
Another wolf attack on livestock was confirmed in Jackson County.
| CROP AND LIVESTOCK PROGRESS | ||||
Commodity | Current week | Previous week | Previous year | 5-year average |
| Alfalfa | (percent) | (percent) | (percent) | (percent) |
| 1st cutting harvested ................................... | 4 | 3 | 6 | 10 |
| Barley | ||||
| Emerged..................................................... | 80 | 68 | 62 | 86 |
| Corn | ||||
| Planted ....................................................... | 74 | 57 | 73 | 77 |
| Emerged..................................................... | 37 | 23 | 27 | 40 |
| Dry edible beans | ||||
| Planted ....................................................... | 11 | 5 | 28 | 13 |
| Emerged..................................................... | 2 | 1 | 4 | 2 |
| Onions | ||||
| Planted ....................................................... | 88 | 78 | 92 | 89 |
| Potatoes inside San Luis Valley | ||||
| Planted ....................................................... | 86 | 69 | 89 | 93 |
| Emerged..................................................... | 4 | -- | 7 | 8 |
| Potatoes outside San Luis Valley | ||||
| Planted ....................................................... | 70 | 55 | 63 | 84 |
| Emerged..................................................... | 21 | 7 | 35 | 42 |
| Proso millet | ||||
| Planted ....................................................... | 21 | 20 | 24 | 21 |
| Sorghum | ||||
| Planted ....................................................... | 25 | 12 | 28 | 21 |
| Sugarbeets | ||||
| Planted ....................................................... | 98 | 94 | 91 | 94 |
| Emerged..................................................... | 71 | 51 | 40 | 59 |
| Sunflowers | ||||
| Planted ....................................................... | 19 | 9 | 22 | 15 |
| Winter wheat | ||||
| Jointing ....................................................... | 94 | 80 | 84 | 92 |
| Headed....................................................... | 44 | 21 | 43 | 44 |
| Coloring ...................................................... | 7 | 1 | -- | 1 |
NA – not available (--) – zero
| DAYS SUITABLE FOR FIELDWORK AND SOIL MOISTURE CONDITION | ||||
| Current week | Previous week | Previous year | 5-year average | |
| Days suitable for fieldwork .............................. | 5.6 | 6.2 | 5.6 | 5.3 |
| Topsoil moisture | (percent) | (percent) | (percent) | (percent) |
| Very short................................................... | 16 | 20 | 5 | 10 |
| Short .......................................................... | 25 | 22 | 13 | 20 |
| Adequate.................................................... | 52 | 53 | 68 | 64 |
| Surplus....................................................... | 7 | 5 | 14 | 6 |
| Subsoil moisture | ||||
| Very short................................................... | 16 | 15 | 12 | 17 |
| Short .......................................................... | 14 | 16 | 20 | 25 |
| Adequate.................................................... | 64 | 66 | 63 | 56 |
| Surplus....................................................... | 6 | 3 | 5 | 2 |
NA – not available (--) – zero
| CROP, LIVE STOCK, PASTURE AND RANGE CONDITION | ||||
Commodity | Current week | Previous week | Previous year | 5-year average |
| Alfalfa hay | (percent) | (percent) | (percent) | (percent) |
| Very poor.................................................... | -- | -- | 2 | 5 |
| Poor............................................................ | 2 | 2 | 10 | 9 |
| Fair ............................................................. | 12 | 18 | 28 | 24 |
| Good .......................................................... | 67 | 60 | 50 | 52 |
| Excellent..................................................... | 19 | 20 | 10 | 10 |
| Barley | ||||
| Very poor.................................................... | -- | -- | 1 | 1 |
| Poor............................................................ | -- | -- | 1 | 3 |
| Fair ............................................................. | 12 | 18 | 15 | 22 |
| Good .......................................................... | 65 | 55 | 30 | 48 |
| Excellent..................................................... | 23 | 27 | 53 | 26 |
| Onion | ||||
| Very poor.................................................... | -- | NA | -- | 1 |
| Poor............................................................ | -- | NA | -- | 1 |
| Fair ............................................................. | 30 | NA | 30 | 27 |
| Good .......................................................... | 30 | NA | 30 | 59 |
| Excellent..................................................... | 40 | NA | 40 | 12 |
| Pasture and range | ||||
| Very poor.................................................... | -- | -- | 4 | 13 |
| Poor............................................................ | 15 | 16 | 15 | 14 |
| Fair ............................................................. | 31 | 40 | 39 | 33 |
| Good .......................................................... | 51 | 39 | 35 | 34 |
| Excellent..................................................... | 3 | 5 | 7 | 6 |
| Sugarbeets | ||||
| Very poor.................................................... | -- | NA | NA | NA |
| Poor............................................................ | -- | NA | NA | NA |
| Fair ............................................................. | 15 | NA | NA | NA |
| Good .......................................................... | 61 | NA | NA | NA |
| Excellent..................................................... | 24 | NA | NA | NA |
| Winter wheat | ||||
| Very poor.................................................... | 8 | 4 | 8 | 12 |
| Poor............................................................ | 20 | 19 | 31 | 17 |
| Fair ............................................................. | 31 | 32 | 29 | 30 |
| Good .......................................................... | 39 | 43 | 25 | 35 |
| Excellent..................................................... | 2 | 2 | 7 | 6 |
| Livestock | ||||
| Very poor.................................................... | -- | 1 | 2 | 1 |
| Poor............................................................ | 3 | 4 | 5 | 5 |
| Fair ............................................................. | 21 | 32 | 25 | 21 |
| Good .......................................................... | 67 | 56 | 44 | 60 |
| Excellent..................................................... | 9 | 7 | 24 | 13 |
NA – not available (--) – zero


