19.8% of Colorado adults have unpaid medical bills, study finds
The share of adults in Colorado with unpaid medical debts is now 19.8 percent, the 37th highest level among all 50 states, according to a recent analysis by the website 24/7 Wall St.
The median Colorado medical debt that has been assigned to collections agencies was $755, the analysis said. The state has an uninsured rate of 7.5 percent, and 14.3 percent of its adults are rated in fair or poor health, according to the 24/7 Wall St. report.
Nationwide, 22.7 percent of U.S. adults have medical debts that are past due, according to the study, which is based on a 2018 analysis published by the Financial Industry Regulatory Authority (FINRA).
The high cost of health care remains a key concern for Americans because medical bills are a factor in about 66 percent of personal bankruptcies, according to 24/7 Wall St.
States with lower shares of residents dealing with unpaid medical bills tend to have lower uninsured rates and higher annual incomes, the study found.
Medical Debt Burdens Among the 50 States
Rank | State | % of Adult Population With Unpaid Medical Bills | Median Medical Debt in Collections | Uninsured Rate | Adults in Fair or Poor Health |
1 | Mississippi | 40.9% | $813 | 12.1% | 22.2% |
2 | South Carolina | 31.4% | $787 | 10.5% | 19.1% |
3 | West Virginia | 31.2% | $680 | 6.4% | 24.1% |
4 | Georgia | 29.9% | $808 | 13.7% | 18.8% |
5 | Arkansas | 29.0% | $596 | 8.2% | 24.5% |
6 | Texas | 29.0% | $829 | 17.7% | 18.2% |
7 | Alabama | 28.7% | $801 | 10.0% | 21.4% |
8 | Louisiana | 28.4% | $697 | 8.0% | 21.1% |
9 | Delaware | 27.6% | $601 | 5.7% | 15.8% |
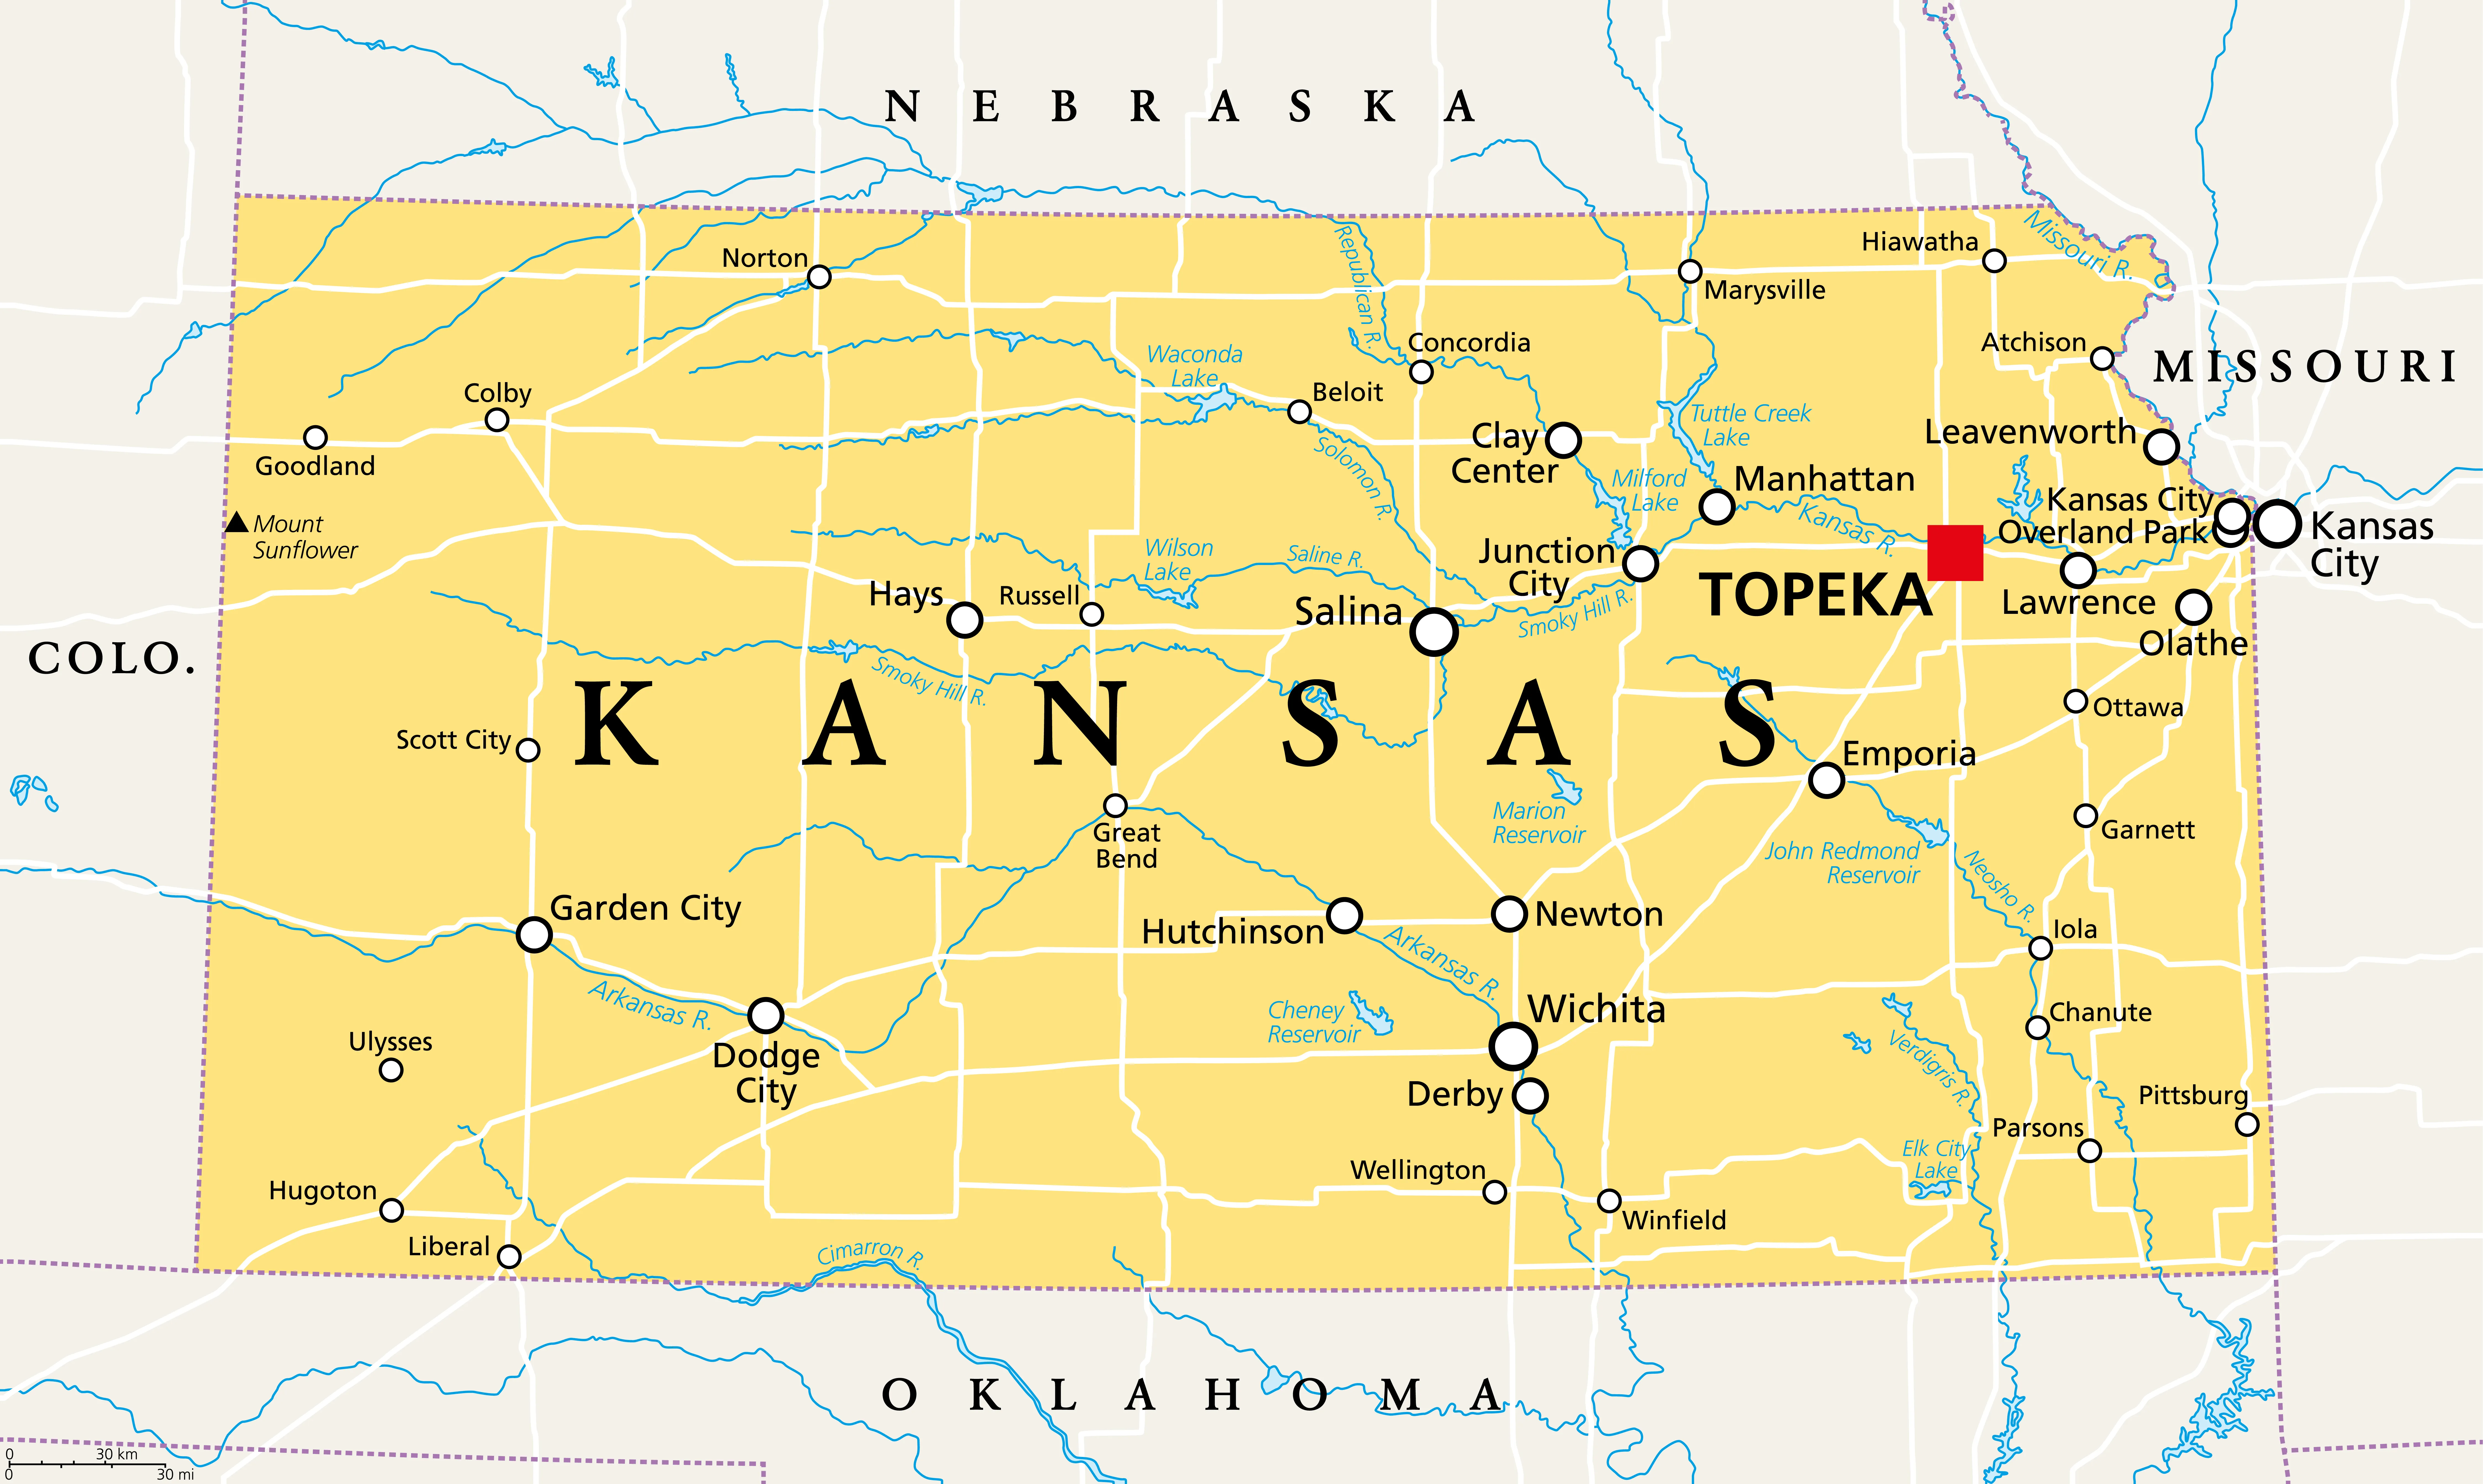
10 | Kansas | 27.2% | $735 | 8.8% | 15.0% |
11 | North Carolina | 27.0% | $698 | 10.7% | 17.6% |
12 | Missouri | 26.9% | $781 | 9.4% | 18.5% |
13 | Indiana | 26.8% | $761 | 8.3% | 17.7% |
14 | Oklahoma | 26.7% | $857 | 14.2% | 19.6% |
15 | Alaska | 26.1% | $1,316 | 12.6% | 13.4% |
16 | Maine | 26.0% | $729 | 8.0% | 15.4% |
17 | Montana | 26.0% | $768 | 8.2% | 13.9% |
18 | Kentucky | 25.8% | $459 | 5.6% | 21.3% |
19 | Tennessee | 25.6% | $855 | 10.1% | 19.1% |
20 | Wyoming | 24.7% | $1,252 | 10.5% | 15.1% |
21 | New Hampshire | 24.6% | $458 | 5.7% | 13.6% |
22 | South Dakota | 24.5% | $542 | 9.8% | 11.8% |
23 | Ohio | 24.4% | $531 | 6.5% | 17.0% |
24 | Idaho | 23.9% | $790 | 11.1% | 15.3% |
25 | Vermont | 23.4% | $469 | 4.0% | 12.5% |
26 | Virginia | 23.1% | $680 | 8.8% | 15.9% |
27 | Nevada | 23.0% | $775 | 11.2% | 20.5% |
28 | Wisconsin | 22.6% | $1,015 | 5.5% | 15.4% |
29 | Iowa | 22.0% | $535 | 4.7% | 13.1% |
30 | Nebraska | 21.4% | $481 | 8.3% | 14.2% |
31 | Pennsylvania | 21.1% | $512 | 5.5% | 15.1% |
32 | Florida | 20.7% | $921 | 13.0% | 18.5% |
33 | North Dakota | 20.3% | $624 | 7.3% | 14.3% |
34 | Oregon | 20.3% | $647 | 7.1% | 15.8% |
35 | Michigan | 20.2% | $497 | 5.4% | 17.4% |
36 | Utah | 20.1% | $997 | 9.4% | 12.1% |
37 | Colorado | 19.8% | $755 | 7.5% | 14.3% |
38 | Illinois | 19.8% | $555 | 7.0% | 17.2% |
39 | Maryland | 19.1% | $498 | 6.0% | 13.9% |
40 | Arizona | 18.0% | $888 | 10.6% | 17.8% |
41 | New York | 17.7% | $446 | 5.4% | 16.1% |
42 | Washington | 17.7% | $559 | 6.4% | 13.9% |
43 | Minnesota | 17.3% | $360 | 4.4% | 12.0% |
44 | Rhode Island | 17.2% | $468 | 4.1% | 14.8% |
45 | Massachusetts | 16.5% | $354 | 2.8% | 13.8% |
46 | Connecticut | 16.2% | $441 | 5.3% | 13.8% |
47 | New Jersey | 16.2% | $510 | 7.4% | 16.5% |
48 | New Mexico | 15.1% | $731 | 9.5% | 20.8% |
49 | California | 14.3% | $740 | 7.2% | 17.5% |
50 | Hawaii | 13.4% | $232 | 4.1% | 14.0% |
Source: 24/7 Wall St.


