Ag stats: Colorado crop progress and condition report – week ending June 14, 2020
Mixed weather throughout Colorado kept a few producers out of the field last week, according to the Mountain Region Field Office of the National Agricultural Statistics Service, USDA.
Northwestern counties received rain and snow which greatly benefitted soil moisture supplies and rangeland conditions. Northeastern counties received measurable precipitation early last week. The moisture boosted supplies for flood irrigation in areas and also provided a slight reprieve to dry conditions. Isolated severe weather and damaging hail was reported in areas. Hot and dry weather later in the week continued to be a concern for non-irrigated crops and pasture conditions. Winter wheat continued to show signs of stress including uneven growth and early coloring in areas.
In east central counties, isolated moisture was received, but conditions remained very dry and high winds were noted. In Akron and other localities to the northeast, severe weather brought winds in excess of 100 miles per hour, causing significant damage to structures and crops in the area. Isolated and damaging hail was also reported.
The San Luis Valley saw cold temperatures early in the week which hurt the alfalfa crop. County reports noted barley and potatoes were not affected by the cold. Reports also noted that the effects of a prior hailstorm could be seen in alfalfa, potatoes, and barley last week. Damage was isolated yet severe in areas. Conditions remained very dry.
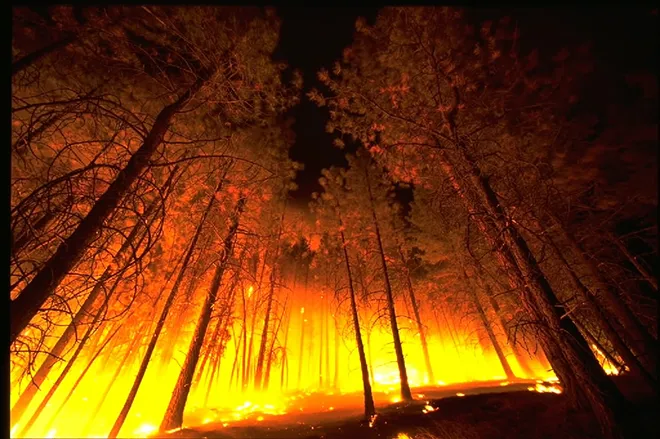
In southeastern counties, slight precipitation was received last week. Conditions remained very dry and fire danger was elevated.
Stored feed supplies were rated 9 percent very short, 18 percent short, 72 percent adequate, and 1 percent surplus.
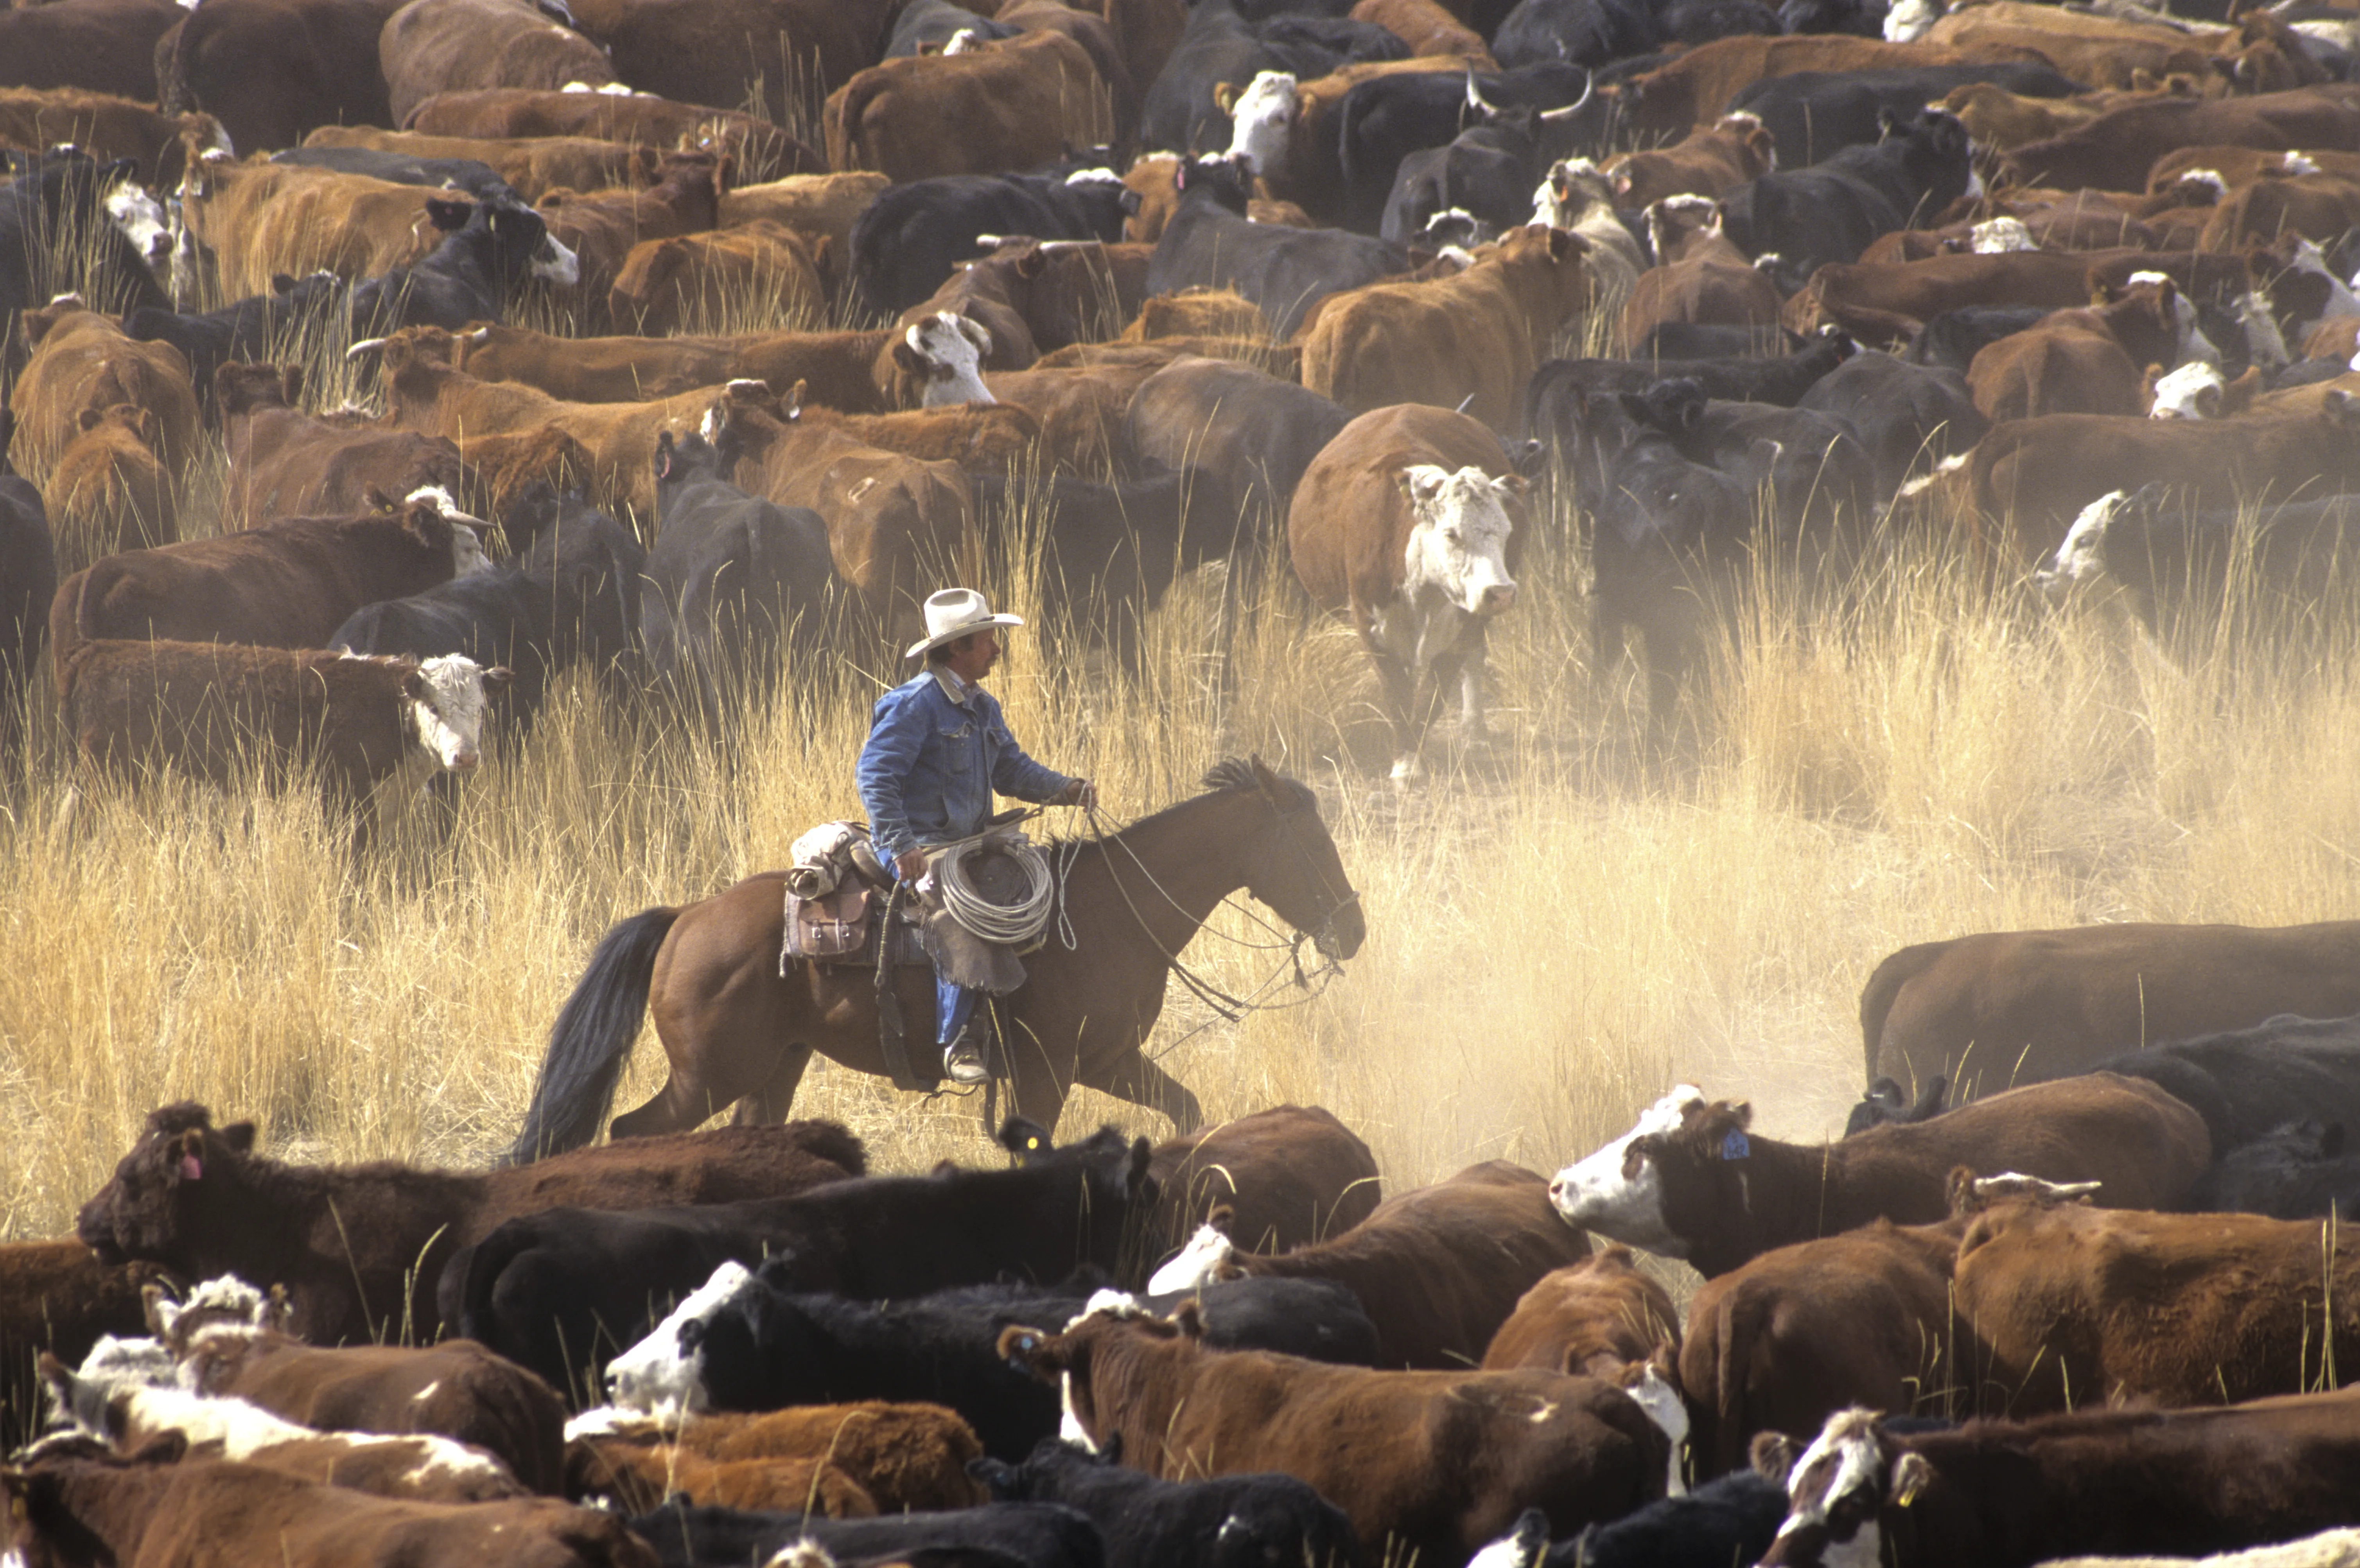
Sheep death loss was 63 percent average and 37 percent light.
Cattle death loss was 94 percent average and 6 percent light.
CROP AND LIVESTOCK PROGRESS | ||||
Commodity | Current week | Previous week | Previous year | 5-year average |
(percent) | (percent) | (percent) | (percent) | |
Alfalfa hay | ||||
1st cutting harvested | 63 | 44 | 50 | 48 |
Barley | ||||
Headed | 5 | -- | 4 | 12 |
Dry edible beans | ||||
Planted | 75 | 56 | 33 | 53 |
Emerged | 31 | 17 | 10 | 27 |
Potatoes inside San Luis Valley | ||||
Emerged | 81 | 60 | 58 | 69 |
Potatoes outside San Luis Valley | ||||
Emerged | 96 | 93 | 92 | 94 |
Proso Millet | ||||
Planted | 87 | 79 | 68 | NA |
Sorghum | ||||
Planted | 68 | 56 | 72 | 68 |
Emerged | 42 | 20 | 28 | 34 |
Sugarbeets | ||||
Emerged | 98 | 93 | 94 | NA |
Sunflowers | ||||
Planted | 78 | 51 | 54 | 46 |
Winter wheat | ||||
Headed | 92 | 86 | 89 | 95 |
Turning color | 32 | 10 | 15 | 36 |
Mature | 1 | NA | -- | 2 |
DAYS SUITABLE FOR FIELDWORK AND SOIL MOISTURE CONDITION | ||||
Current week | Previous week | Previous year | 5-year average | |
Days suitable for fieldwork | 5.9 | 6.6 | 6.4 | 6.2 |
Topsoil moisture | (percent) | (percent) | (percent) | (percent) |
Very short | 20 | 23 | 2 | 6 |
Short. | 55 | 40 | 11 | 17 |
Adequate | 25 | 37 | 85 | 72 |
Surplus. | -- | -- | 2 | 5 |
Subsoil moisture | ||||
Very short | 21 | 22 | 2 | 5 |
Short. | 50 | 34 | 14 | 15 |
Adequate | 29 | 44 | 81 | 77 |
Surplus. | -- | -- | 3 | 3 |
CROP, LIVESTOCK, PASTURE AND RANGE CONDITION | ||||
Commodity | Current week | Previous week | Previous year | 5-year average |
(percent) | (percent) | (percent) | (percent) | |
Alfalfa hay | ||||
Very poor | 11 | 6 | 1 | 2 |
Poor. | 16 | 10 | 7 | 7 |
Fair. | 28 | 28 | 8 | 22 |
Good. | 41 | 48 | 63 | 55 |
Excellent | 4 | 8 | 21 | 14 |
Barley | ||||
Very poor | -- | -- | -- | -- |
Poor. | 6 | 1 | 3 | 1 |
Fair. | 27 | 28 | 15 | 19 |
Good. | 48 | 51 | 47 | 52 |
Excellent | 19 | 20 | 35 | 28 |
Corn | ||||
Very poor | 2 | 3 | -- | -- |
Poor. | 7 | 9 | 4 | 3 |
Fair. | 65 | 36 | 18 | 20 |
Good. | 22 | 43 | 68 | 66 |
Excellent | 4 | 9 | 10 | 11 |
Onions | ||||
Very poor | 2 | 2 | -- | 1 |
Poor. | 3 | 4 | -- | 3 |
Fair. | 26 | 27 | 6 | 15 |
Good. | 65 | 62 | 86 | 71 |
Excellent | 4 | 5 | 8 | 10 |
Pasture and range | ||||
Very poor | 27 | 23 | 1 | 5 |
Poor. | 13 | 16 | 2 | 10 |
Fair. | 26 | 29 | 15 | 21 |
Good. | 34 | 32 | 67 | 52 |
Excellent | -- | -- | 15 | 12 |
Potatoes inside San Luis Valley | ||||
Very poor | -- | -- | -- | NA |
Poor. | 3 | 5 | 10 | NA |
Fair. | 18 | 25 | 30 | NA |
Good. | 53 | 45 | 40 | NA |
Excellent | 26 | 25 | 20 | NA |
Potatoes outside San Luis Valley | ||||
Very poor | 2 | 2 | -- | -- |
Poor. | 3 | 3 | -- | -- |
Fair. | 21 | 21 | 19 | 12 |
Good. | 62 | 62 | 73 | 71 |
Excellent | 12 | 12 | 8 | 17 |
Sorghum | ||||
Very poor | 2 | 3 | NA | NA |
Poor. | 5 | 6 | NA | NA |
Fair. | 53 | 43 | NA | NA |
Good. | 34 | 39 | NA | NA |
Excellent | 6 | 9 | NA | NA |
Sugarbeets | ||||
Very poor | 3 | 2 | -- | -- |
Poor. | 8 | 6 | 1 | 2 |
Fair. | 28 | 28 | 39 | 21 |
Good. | 48 | 51 | 48 | 63 |
Excellent | 13 | 13 | 12 | 14 |
Winter wheat | ||||
Very poor | 16 | 17 | 2 | 4 |
Poor. | 22 | 21 | 3 | 12 |
Fair. | 31 | 30 | 16 | 27 |
Good. | 29 | 30 | 55 | 44 |
Excellent | 2 | 2 | 24 | 13 |
Livestock | ||||
Very poor | 2 | 1 | 1 | -- |
Poor. | 6 | 5 | 4 | 2 |
Fair. | 22 | 22 | 20 | 14 |
Good. | 54 | 62 | 62 | 71 |
Excellent | 16 | 10 | 13 | 13 |


