How deadly is COVID-19? A biostatistician explores the question

The latest statistics, as of July 10, show COVID-19-related deaths in U.S. are just under 1,000 per day nationally, which is down from a peak average of about 2,000 deaths per day in April. However, cases are once again rising very substantially, which is worrisome as it may indicate that substantial increases in COVID-19 deaths could follow. How do these numbers compare to deaths of other causes? Ron Fricker, statistician and disease surveillance expert from Virginia Tech, explains how to understand the magnitude of deaths from COVID-19.
As a disease surveillance expert, what are some of the tools you have to understand the deaths caused by a disease?
Disease surveillance is the process by which we try to understand the incidence and prevalence of diseases across the country, often with the particular goal of looking for increases in disease incidence. The challenge is separating signal from noise, by which I mean trying to discern an increase in disease incidence (the signal) from the day-to-day fluctuations in that disease (the noise). The hope is to identify any increase as quickly as possible so that medical and public health professionals can intervene and try to mitigate the disease’s effects on the population.
A critical tool in this effort is data. Often disease data is collected and aggregated by local and state public health departments and the Centers for Disease Control and Prevention from data that is reported by doctors and medical facilities. Surveillance systems then use this data and a variety of algorithms to attempt to find a signal amidst the noise.
Early on, many people pointed out that the flu has tens of thousands of deaths a year, and so COVID-19 didn’t seem so bad. What’s wrong with that comparison?
The CDC estimates the average number of flu-related deaths since 2010-11 is around 36,000 per year. This varies from a low of 12,000 deaths in 2011-12 to a high of 61,000 deaths in 2017-18. Thus, the number of COVID-19 deaths to date is three to four times greater than the annual average number of flu-related deaths over the past decade; it is 10 times larger when compared to the 2010-11 flu season but only about twice as large compared to 2017-18.
To make this a fair comparison, note that seasonal influenza mostly occurs over a few months, usually in late fall or early winter. So, the time periods are roughly comparable, with most of the COVID-19-related deaths occurring since late March. However, COVID-19 does not appear to be seasonal, and fatalities are a lagging measure because the time from infection to death is weeks if not months in duration, so the multiples in the previous paragraph will be greater by the end of the year.
Furthermore, while death rates have been coming down from a peak of more than 2,700 on April 21, 2020, the United States is now averaging just under 1,000 deaths per day as of July 10, and given the dramatic increase in cases of late, we should expect the fatality rate to further rise. For example, the University of Washington’s IHME model currently predicts slightly more than 208,000 COVID-19-related deaths by November 1.
So, by any comparison, the COVID-19 death rate is significantly higher than the seasonal influenza death rate.
What are some comparisons that could provide some context in understanding the scale of deaths caused by COVID-19?
As of this writing, more than 130,000 people have died of COVID-19, and that total could grow to 200,000 or more by fall. Those numbers are so big, they’re hard to grasp.
Michigan Stadium in Ann Arbor is the largest football stadium in the United States. It holds 107,420 people, so no football stadium in the country is large enough to hold everyone who has died from COVID-19 thus far. By the time bowl season comes along, assuming we have a football season this year, the number of COVID-19 fatalities will likely exceed the capacity of the Rose and Cotton bowl stadiums combined.
The state of Wyoming has a population of slightly less than 600,000 people, so it’s the equivalent of one out of every five people in that state dying in the last four months. By this fall, the COVID-19 death total will be the equivalent of fully one-third of the people in Wyoming dying.
The populations of Grand Rapids, Michigan; Huntsville, Alabama; and Salt Lake City, Utah are each just over 200,000 people. Imagine if everyone in one of those cities died over the course of six months. That’s what COVID-19 may look like by fall.
How do COVID-19 deaths compare to chronic diseases like cancer or heart disease?
Today, COVID-19 ranks as the sixth leading cause of death in the United States, following heart disease, cancer, accidents, lower chronic respiratory diseases and stroke. Heart disease is the leading cause, with just over 647,000 Americans dying from it each year. Alzheimer’s disease, formerly the sixth largest cause of death, kills just over 121,000 people per year. If the University of Washington IHME model’s current prediction of COVID-19-related deaths comes to pass, COVID-19 will be the third leading cause of death in the United States by the end of the year.
The American Cancer Society estimates that in 2020 there will be an estimated 1.8 million new cancer cases diagnosed and 606,520 cancer deaths in the United States. Lung cancer is estimated to kill about 135,000 people in the US in 2020, so the number of COVID-19 deaths is currently equivalent and will exceed it soon. Of course, it is important to note that the COVID-19 deaths have occurred in about the past four months while the number of lung cancer deaths is for a year. So, COVID-19 deaths are occurring at roughly three times the rate of lung cancer deaths.
What are some historical comparisons that you think are useful in understanding the scale of deaths from COVID-19?
The 1918 influenza pandemic was similar in some ways to the current pandemic and different in other ways. One key difference is the age distribution of deaths, where COVID-19 is concentrated among older adults while the the 1918 pandemic affected all ages. In my state of Virginia, only 8% of the people who died in the 1918 pandemic were more than 50 years old, compared to more than 97% for COVID-19.
The CDC estimates that the 1918 pandemic resulted in about 675,000 deaths in the United States, so slightly more than five times the current number of COVID-19 deaths. In October of 1918, the worst month for the influenza pandemic, about 195,000 people died – well more than all who have died so far from COVID-19.
As with any historical comparison, there are important qualifiers. In this case, the influenza pandemic started in early 1918 and continued well into 1919, whereas COVID-19 deaths are for about one-third of a year (March through June). However, today the United States’ population is about three times the size of the population in 1918. These two factors roughly “cancel out,” and so it is reasonable to think about the 1918 epidemic being about five times worse than COVID-19, at least thus far.
In comparison to past wars, the U.S. has now had more deaths from COVID-19 than all the combat-related deaths in all the wars since the Korean War, including the Vietnam War and Operations Desert Shield and Desert Storm. In World War II there were 291,557 combat casualties. So the number of people who have died from COVID-19 thus far is about 45% of the WWII combat casualties. By the fall, it could be more than 70%.
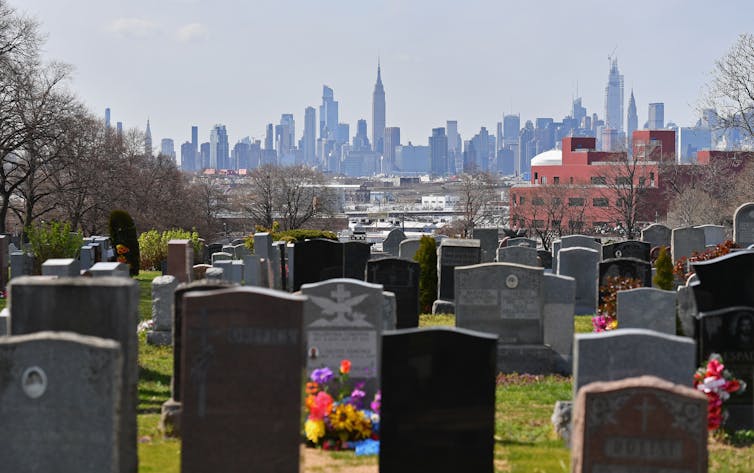
Finally, note that the number of confirmed and probable deaths from COVID-19 in New York City (23,247 on July 10, 2020) is more than eight times the number who died in the 9/11 attack (2,753).![]()
Ron Fricker, Professor of Statistics and Associate Dean for Faculty Affairs and Administration, Virginia Tech
This article is republished from The Conversation under a Creative Commons license. Read the original article.


