This is the best county to live in Colorado

The U.S. may have the largest economy in the world, but in other key measures indicative of quality of life, it is far from number one. Based on the United Nations Development Programme's Human Development Index, a tool used for gauging and comparing quality of life across geographies, the United States ranks as the 17th best country to live in worldwide.
While quality of life across the U.S. as a whole trails over a dozen other nations, there are parts of the country that, if analyzed through the lens of the HDI, would rank at or near the top of the list of the best places to live globally.
Inspired by the HDI, 24/7 Wall St. created an index consisting of three measures â life expectancy at birth, bachelor's degree attainment, and poverty rate â to identify the best counties to live in in every state.
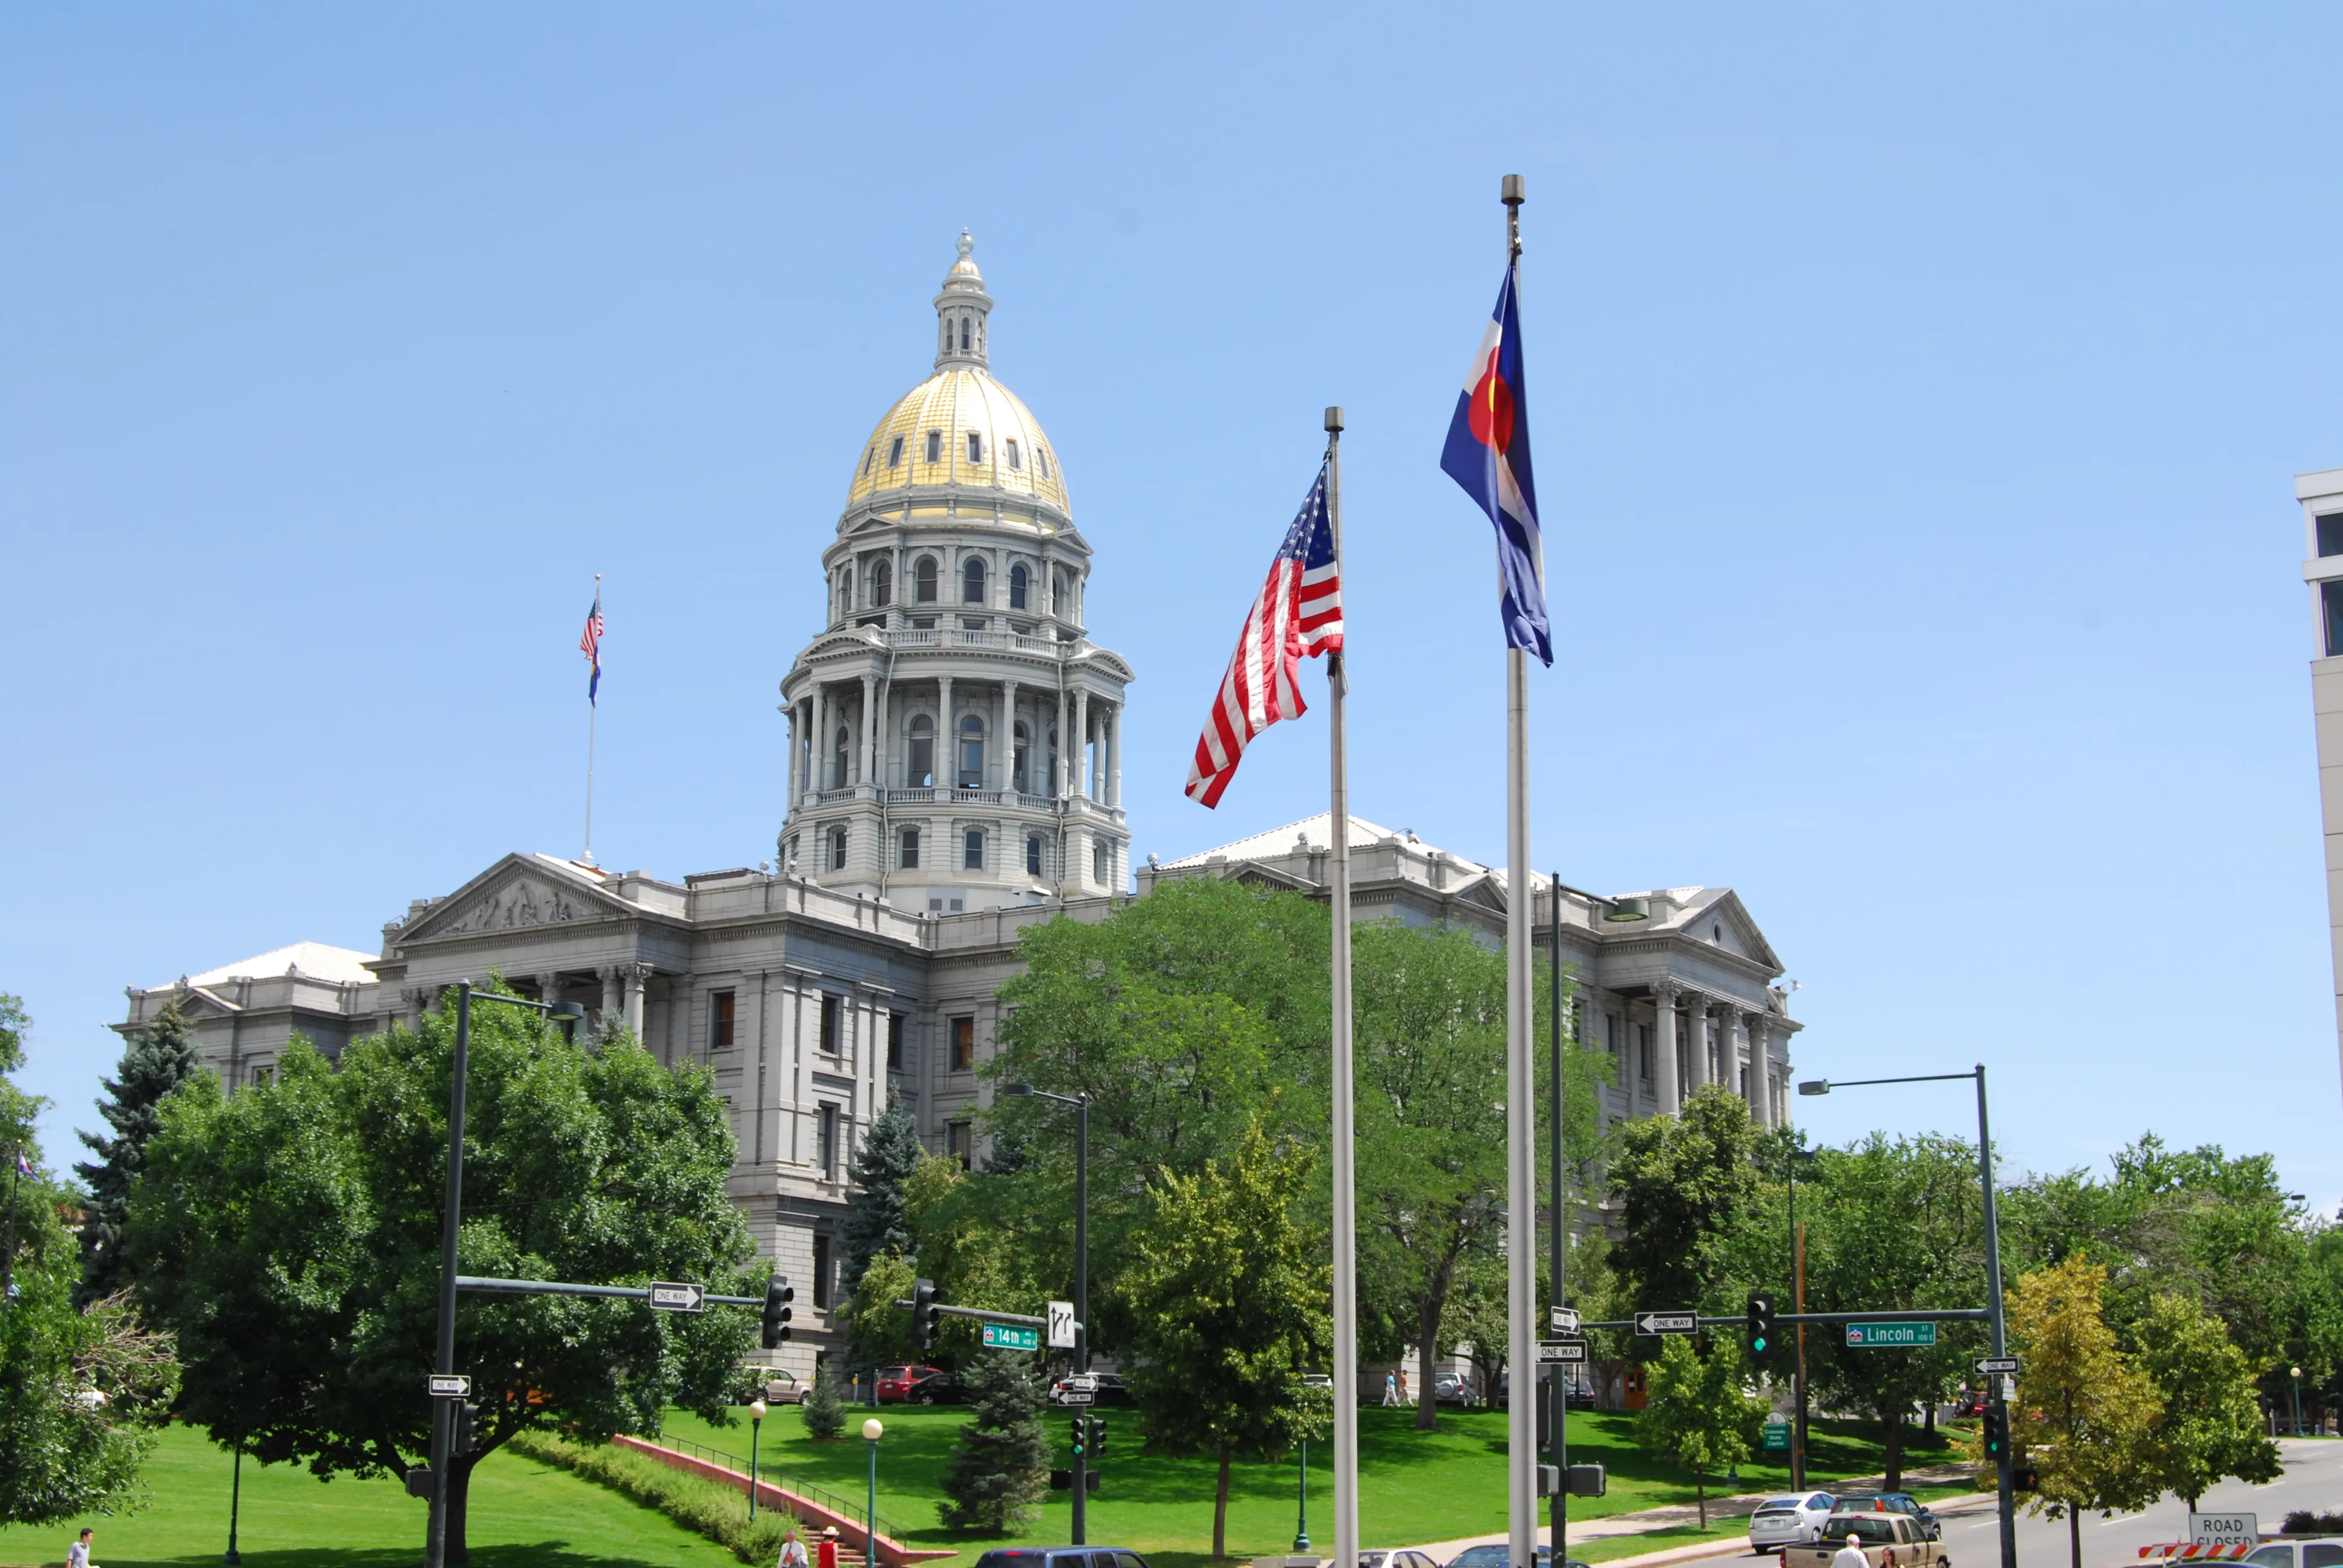
Pitkin County, Colorado, located southwest of Denver in the Rocky Mountains, ranks as the best county to live in in the state. With an estimated life expectancy at birth of 94.4 years -- 15 years longer than the national average -- the county has one of the healthiest populations in the United States. Health outcomes tend to be better in areas with well educated, financially secure populations. In Pitkin County, 60.8% of adults have a bachelor's degree or higher, and only 6.7% of the population live below the poverty line, compared to Colorado's 40.9% bachelor's degree attainment rate and 10.3% poverty rate.
Home to the ski resort town of Aspen, Pitkin County is a destination for wealthy Americans as well as outdoor enthusiasts. Recreational opportunities in the area include hiking, climbing, boating, fishing and more.
Data on bachelor's degree attainment and poverty are from the 2019 U.S. Census Bureau's American Community Survey and are five-year estimates. Data on average life expectancy at birth came from the 2021 County Health Rankings, a joint program of the Robert Wood Johnson Foundation and University of Wisconsin Population Health Institute, and are based on mortality data from the years 2017 to 2019. Supplemental data on population and income are from the ACS, and unemployment rates are seasonally adjusted for May 2021 and are from the Bureau of Labor Statistics. Only independent cities, counties, and county equivalents with populations of 10,000 or more were considered.
Place | Poverty rate (%) | Adults with a bachelor's degree (%) | Life expectancy at birth (years) |
|---|---|---|---|
Alabama: Shelby County | 7.5 | 42.9 | 80.7 |
Alaska: Juneau City and Borough | 7.7 | 38.4 | 81.1 |
Arizona: Maricopa County | 13.8 | 32.7 | 80.5 |
Arkansas: Benton County | 9.4 | 33.4 | 79.9 |
California: Marin County | 7.2 | 59.5 | 85.4 |
Colorado: Pitkin County | 6.7 | 60.8 | 94.4 |
Connecticut: Fairfield County | 8.9 | 47.9 | 83.0 |
Delaware: New Castle County | 11.4 | 36.2 | 78.4 |
Florida: St. Johns County | 8.2 | 44.7 | 81.9 |
Georgia: Forsyth County | 5.7 | 53.1 | 82.3 |
Hawaii: Honolulu County | 8.3 | 35.0 | 82.5 |
Idaho: Teton County | 4.5 | 41.0 | 83.8 |
Illinois: DuPage County | 6.4 | 49.4 | 82.5 |
Indiana: Hamilton County | 4.6 | 59.3 | 82.0 |
Iowa: Dallas County | 5.2 | 50.4 | 82.3 |
Kansas: Johnson County | 5.4 | 56.0 | 81.7 |
Kentucky: Oldham County | 5.9 | 42.4 | 79.8 |
Louisiana: St. Tammany Parish | 11.5 | 33.8 | 78.3 |
Maine: Cumberland County | 9.0 | 47.6 | 80.2 |
Maryland: Howard County | 5.0 | 62.6 | 83.2 |
Massachusetts: Middlesex County | 7.4 | 56.3 | 82.4 |
Michigan: Leelanau County | 6.1 | 44.7 | 82.7 |
Minnesota: Carver County | 4.1 | 48.9 | 83.3 |
Mississippi: Madison County | 9.6 | 48.4 | 76.5 |
Missouri: Platte County | 6.2 | 43.1 | 80.2 |
Montana: Gallatin County | 11.3 | 50.1 | 82.6 |
Nebraska: Sarpy County | 5.9 | 39.8 | 81.3 |
Nevada: Douglas County | 8.7 | 29.4 | 80.7 |
New Hampshire: Rockingham County | 4.6 | 41.4 | 80.9 |
New Jersey: Hunterdon County | 4.5 | 52.7 | 83.5 |
New Mexico: Los Alamos County | 4.4 | 67.4 | 83.8 |
New York: New York County | 15.8 | 61.3 | 85.3 |
North Carolina: Orange County | 13.7 | 59.7 | 82.3 |
North Dakota: Burleigh County | 8.1 | 35.8 | 81.6 |
Ohio: Delaware County | 4.8 | 54.3 | 82.3 |
Oklahoma: Cleveland County | 12.0 | 33.4 | 78.7 |
Oregon: Washington County | 8.9 | 44.4 | 82.7 |
Pennsylvania: Chester County | 6.4 | 53.0 | 81.4 |
Rhode Island: Bristol County | 7.5 | 49.0 | 81.5 |
South Carolina: Beaufort County | 10.2 | 41.2 | 82.9 |
South Dakota: Lincoln County | 4.1 | 37.6 | 84.3 |
Tennessee: Williamson County | 4.4 | 59.8 | 81.7 |
Texas: Collin County | 6.3 | 52.3 | 82.7 |
Utah: Summit County | 5.6 | 55.0 | 85.1 |
Vermont: Chittenden County | 12.1 | 51.3 | 81.8 |
Virginia: Arlington County | 6.8 | 75.3 | 85.9 |
Washington: San Juan County | 10.2 | 49.8 | 86.2 |
West Virginia: Jefferson County | 9.7 | 31.8 | 78.0 |
Wisconsin: Ozaukee County | 5.3 | 49.0 | 82.1 |
Wyoming: Teton County | 6.1 | 57.0 | 87.5 |