Colorado Crop Progress and Condition Summary – May 27, 2018

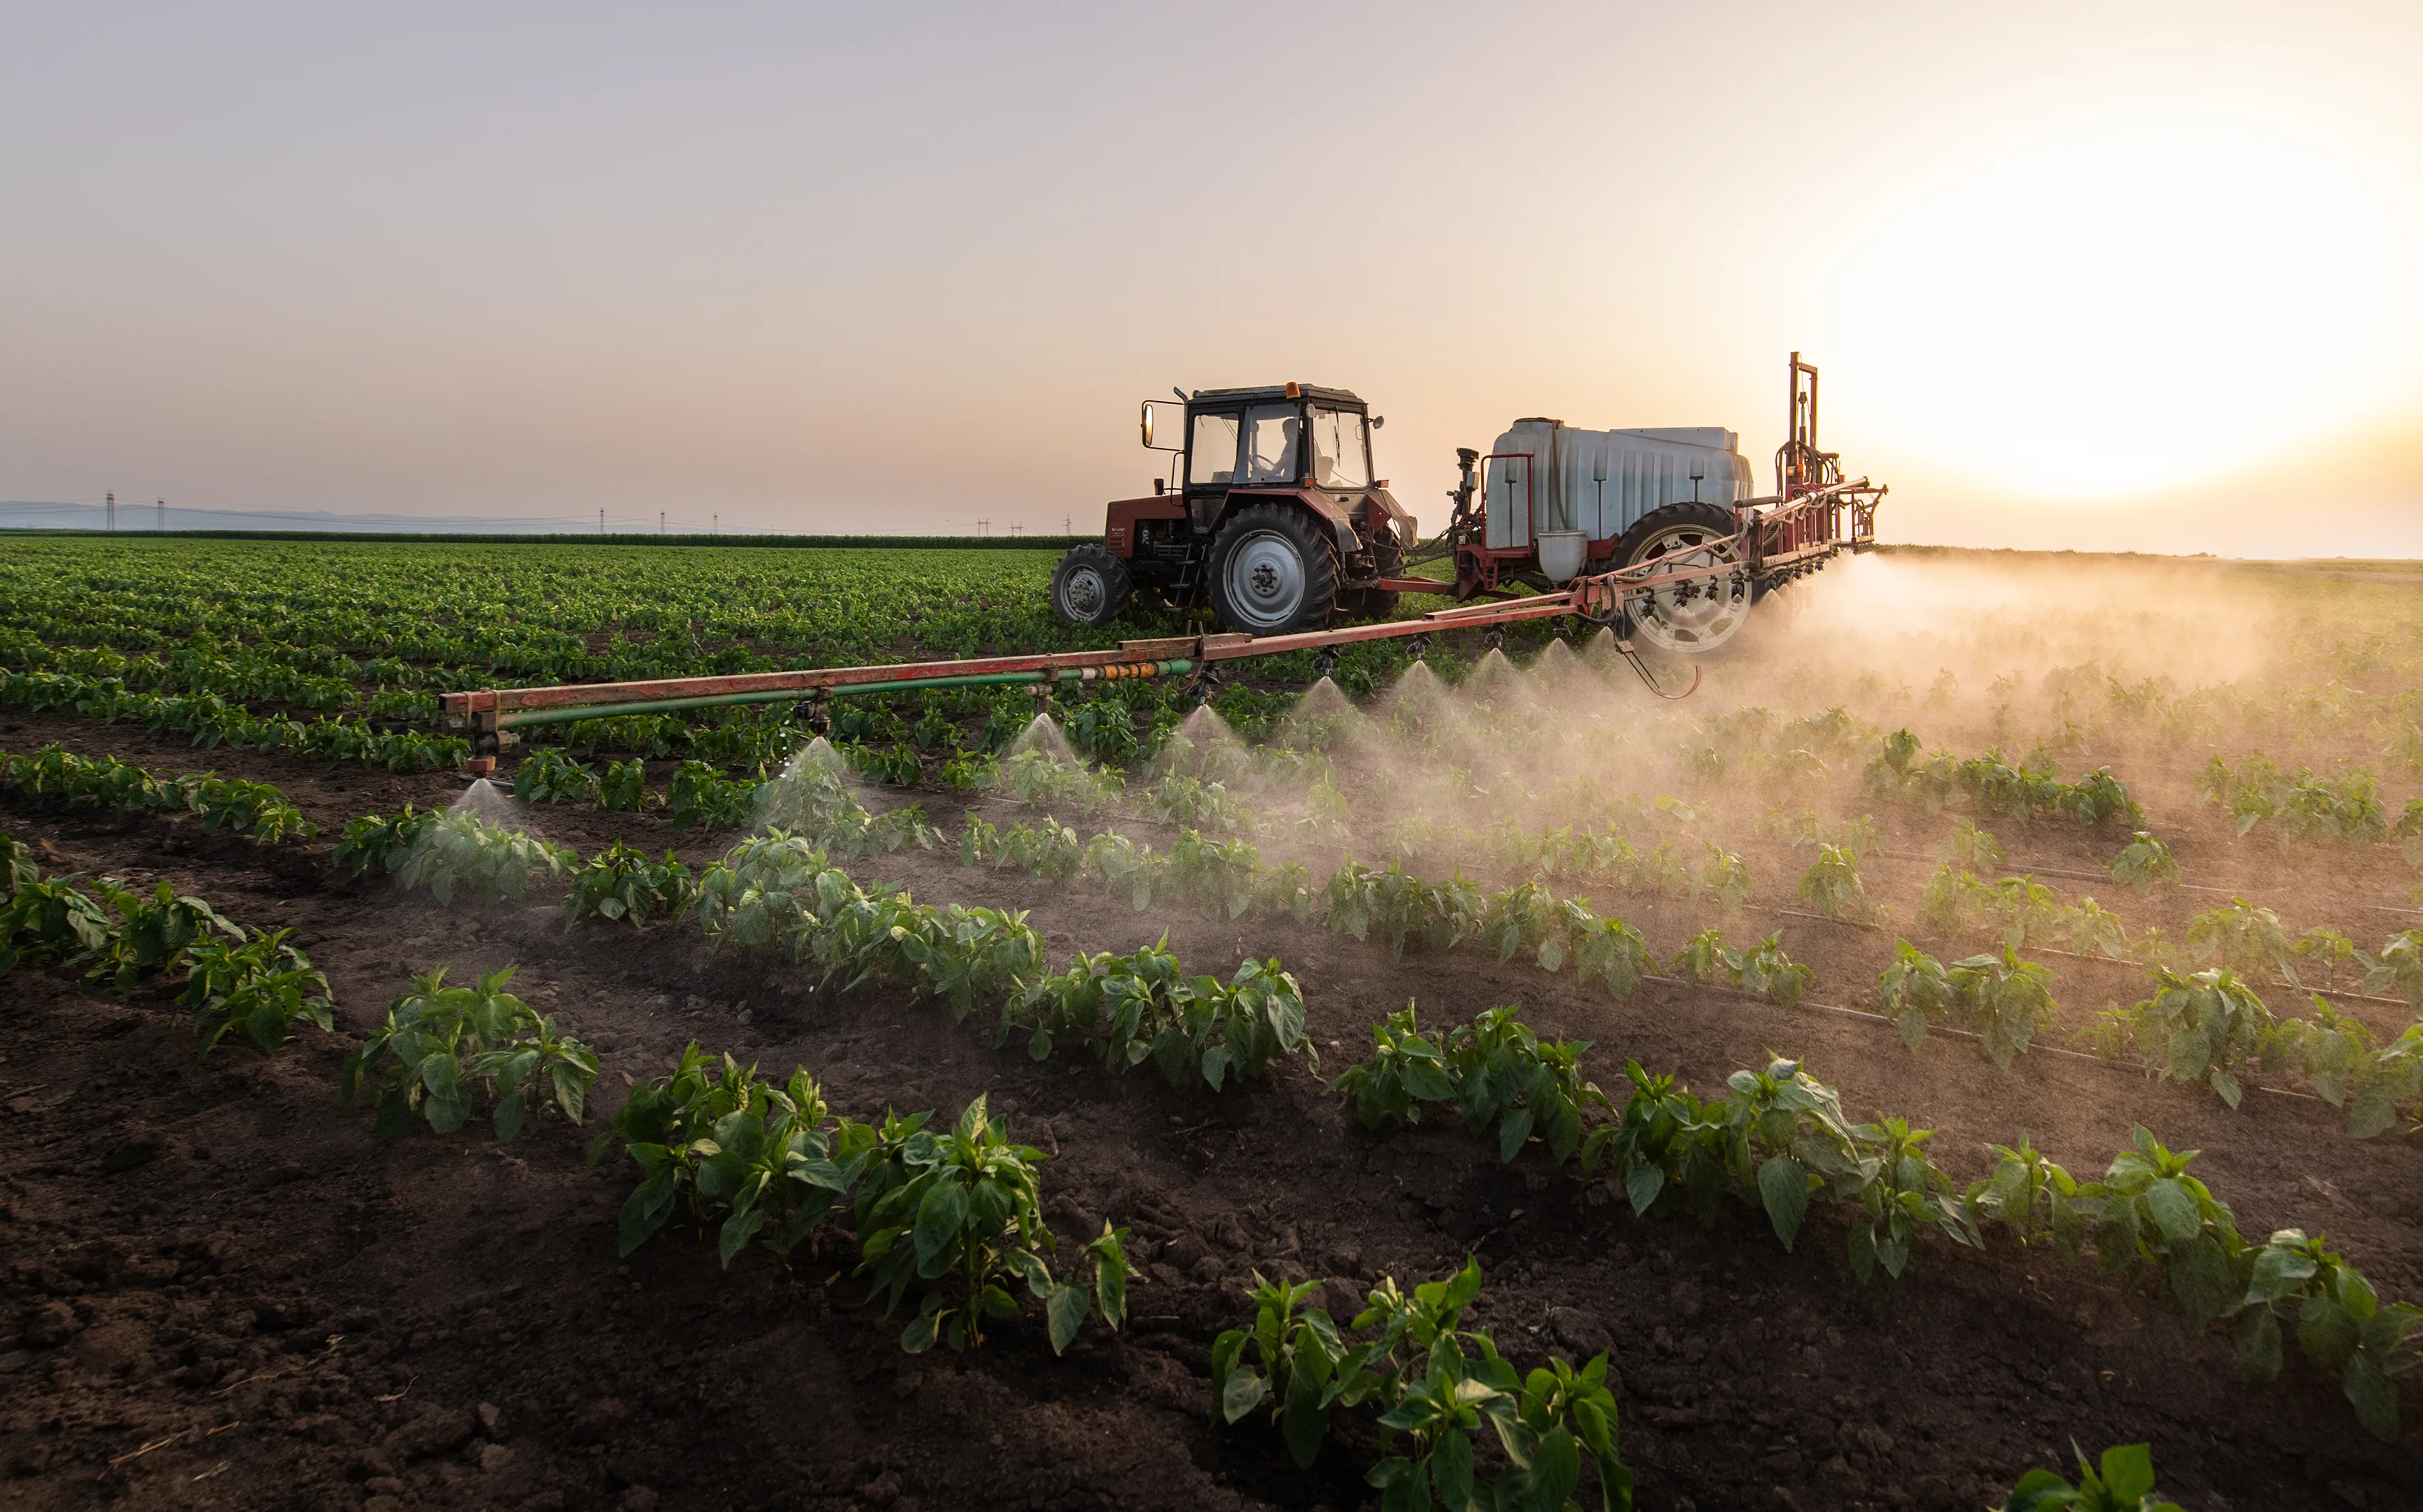
© iStock - Pashalgnatov
Planting activities kept pace with the average last week amidst mixed weather, including above normal temperatures and isolated thunderstorms in areas, according to the Mountain Region Field Office of the National Agricultural Statistics Service, USDA.
In northwestern counties, reporters noted rangeland was in mostly fair to good condition and that livestock were being turned out for the summer. Water was noted to be started on irrigated meadows.
Northeastern counties received locally heavy rain that delayed fieldwork slightly. Reporter comments noted pasture and dryland crop conditions continued to improve from received moisture and that several producers were able to finish planting corn last week.
In east central counties, scattered moisture and locally severe weather was reported. A reporter noted some producers sprayed for Russian wheat aphid last week. Another comment noted pasture conditions declined where no moisture was received.
Southwestern county reporters noted producers continued to sell off livestock in response to dire drought conditions. A reporter mentioned moisture from isolated storms helped improve topsoil moisture but was not enough to improve overall crop or rangeland conditions.
In the San Luis Valley, potato planting was nearing completion. A reporter noted the alfalfa crop was very uneven in places with fields continuing to be evaluated for replacement. Hay supplies were noted to be short and difficult to find. Some areas received a little moisture early last week.
Southeastern counties saw some measurable precipitation last week, but reporters noted conditions remained dry and spring crops were not emerging without irrigation.
As of May 29, 2018, snowpack in Colorado was 29 percent measured as percent of median snowfall. The Southwest and San Luis Valley were 3 and 2 percent, respectively.
Stored feed supplies were rated 8 percent very short, 19 percent short, 71 percent adequate, and 2 percent surplus.
Sheep death loss was 45 percent average and 55 percent light.
Cattle death loss was 71 percent average and 29 percent light.
CROP AND LIVESTOCK PROGRESS | ||||
Commodity | Current week | Previous week | Previous year | 5-year average |
(percent) | (percent) | (percent) | (percent) | |
Alfalfa hay | ||||
1st cutting harvested .......................................... | 3 | 2 | 11 | 10 |
Barley | ||||
Emerged ............................................................ | 94 | 91 | 86 | 89 |
Corn | ||||
Planted .............................................................. | 85 | 67 | 86 | 87 |
Emerged ............................................................ | 58 | 31 | 58 | 58 |
Dry edible beans | ||||
Planted .............................................................. | 8 | 2 | 14 | 15 |
Potatoes inside San Luis Valley | ||||
Planted .............................................................. | 93 | 88 | 86 | 91 |
Emerged ............................................................ | 1 | -- | NA | NA |
Potatoes outside San Luis Valley | ||||
Planted .............................................................. | 88 | 82 | 84 | 94 |
Emerged ............................................................ | 51 | 36 | 75 | 69 |
Sorghum | ||||
Planted .............................................................. | 27 | 8 | 17 | 19 |
Spring wheat | ||||
Planted .............................................................. | 92 | 89 | 86 | 89 |
Emerged ............................................................ | 79 | 69 | 74 | 68 |
Sugarbeets | ||||
Emerged ............................................................ | 84 | 62 | 88 | 81 |
Sunflowers | ||||
Planted .............................................................. | 9 | 1 | 5 | 8 |
Winter wheat | ||||
Jointed ............................................................... | 96 | 86 | 97 | 93 |
Headed .............................................................. | 60 | 34 | 66 | 52 |
Turning color .................................................... | 1 | -- | NA | NA |
DAYS SUITABLE FOR FIELDWORK AND SOIL MOISTURE CONDITION | ||||
Current week | Previous week | Previous year | 5-year average | |
Days suitable for fieldwork .................................... | 5.8 | 5.4 | 4.6 | 5.0 |
Topsoil moisture | (percent) | (percent) | (percent) | (percent) |
Very short ......................................................... | 13 | 12 | -- | 9 |
Short ................................................................. | 23 | 25 | 2 | 17 |
Adequate .......................................................... | 61 | 60 | 85 | 65 |
Surplus.............................................................. | 3 | 3 | 13 | 9 |
Subsoil moisture | ||||
Very short ......................................................... | 14 | 13 | 1 | 15 |
Short ................................................................. | 20 | 24 | 6 | 20 |
Adequate .......................................................... | 65 | 63 | 88 | 60 |
Surplus.............................................................. | 1 | -- | 5 | 5 |
CROP, LIVESTOCK, PASTURE AND RANGE CONDITION | ||||
Commodity | Current week | Previous week | Previous year | 5-year average |
(percent) | (percent) | (percent) | (percent) | |
Alfalfa hay | ||||
Very poor .......................................................... | 9 | 9 | -- | NA |
Poor ................................................................... | 10 | 10 | 6 | NA |
Fair .................................................................... | 27 | 27 | 23 | NA |
Good ................................................................. | 42 | 44 | 63 | NA |
Excellent ........................................................... | 12 | 10 | 8 | NA |
Barley | ||||
Very poor .......................................................... | 1 | 1 | -- | -- |
Poor ................................................................... | 2 | 2 | -- | 1 |
Fair .................................................................... | 32 | 12 | 19 | 21 |
Good ................................................................. | 45 | 73 | 54 | 56 |
Excellent ........................................................... | 20 | 12 | 27 | 22 |
Corn | ||||
Very poor .......................................................... | -- | NA | 1 | 1 |
Poor ................................................................... | 1 | NA | 2 | 3 |
Fair .................................................................... | 7 | NA | 25 | 28 |
Good ................................................................. | 84 | NA | 54 | 55 |
Excellent ........................................................... | 8 | NA | 18 | 13 |
Onions | ||||
Very poor .......................................................... | -- | NA | -- | 1 |
Poor ................................................................... | 3 | NA | -- | 3 |
Fair .................................................................... | 16 | NA | 5 | 12 |
Good ................................................................. | 70 | NA | 80 | 71 |
Excellent ........................................................... | 11 | NA | 15 | 13 |
Pasture and range | ||||
Very poor .......................................................... | 17 | 13 | -- | 10 |
Poor ................................................................... | 20 | 19 | 2 | 15 |
Fair .................................................................... | 27 | 27 | 22 | 26 |
Good ................................................................. | 31 | 40 | 65 | 41 |
Excellent ........................................................... | 5 | 1 | 11 | 8 |
Potatoes outside San Luis Valley | ||||
Very poor .......................................................... | -- | NA | -- | NA |
Poor ................................................................... | 5 | NA | -- | NA |
Fair .................................................................... | 20 | NA | 15 | NA |
Good ................................................................. | 70 | NA | 70 | NA |
Excellent ........................................................... | 5 | NA | 15 | NA |
Spring wheat | ||||
Very poor .......................................................... | 35 | 25 | -- | 1 |
Poor ................................................................... | 3 | 2 | 1 | 1 |
Fair .................................................................... | 9 | 9 | 6 | 24 |
Good ................................................................. | 45 | 56 | 90 | 71 |
Excellent ........................................................... | 8 | 8 | 3 | 3 |
Sugarbeets | ||||
Very poor .......................................................... | 1 | 1 | 1 | 1 |
Poor ................................................................... | 6 | 4 | 3 | 3 |
Fair .................................................................... | 24 | 24 | 23 | 25 |
Good ................................................................. | 54 | 58 | 70 | 61 |
Excellent ........................................................... | 15 | 13 | 3 | 10 |
Winter wheat | ||||
Very poor .......................................................... | 5 | 5 | 4 | 14 |
Poor ................................................................... | 14 | 14 | 12 | 15 |
Fair .................................................................... | 25 | 31 | 34 | 29 |
Good ................................................................. | 49 | 44 | 38 | 34 |
Excellent ........................................................... | 7 | 6 | 12 | 8 |
Livestock | ||||
Very poor .......................................................... | 1 | 1 | -- | -- |
Poor ................................................................... | 4 | 4 | 1 | 3 |
Fair .................................................................... | 19 | 16 | 10 | 18 |
Good ................................................................. | 64 | 69 | 75 | 69 |
Excellent ........................................................... | 12 | 10 | 14 | 10 |