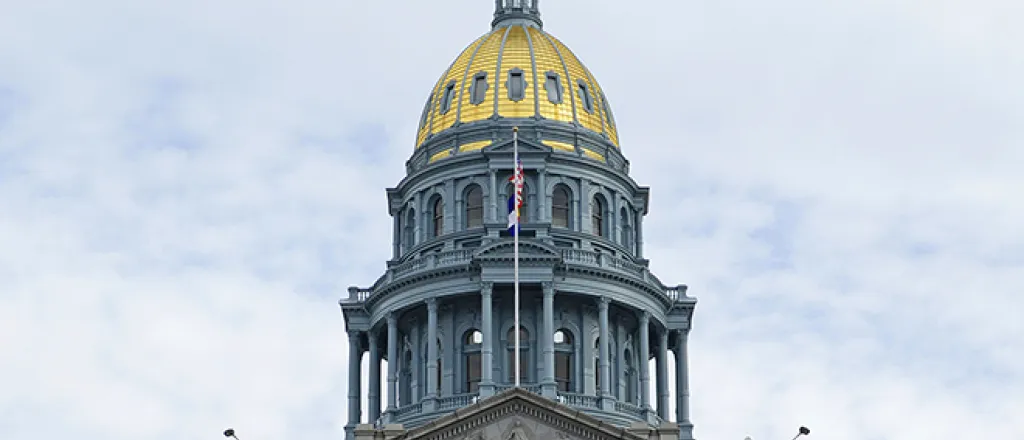
Colorado has reserves equaling 7.9% of its yearly general fund spending
Colorado could cover 7.9 percent of its annual general fund expenditures using only its rainy-day fund, the 27th highest rate among the 50 states, according to a new study from the Tax Foundation.
The states that rely most heavily on volatile revenue from oil, gas and other extracted natural resources – Wyoming, Alaska, North Dakota and New Mexico – had the most robust revenue stabilization funds, according to the analysis. Such states often need to sock away a larger amount of excess revenues during prosperous years to fund state operations when oil and gas prices drop, the study reported.
The rainy-day funds allow states to prepare for inevitable downturns in the economy, according to the Tax Foundation. The funds are now a standard component in states’ fiscal toolkits, the analysis said.
Rank | State | Rainy-Day Balance as % of General Fund Spending |
1 | Wyoming | 109.0% |
2 | Alaska | 52.6% |
3 | North Dakota | 30.0% |
4 | New Mexico | 26.8% |
5 | West Virginia | 16.9% |
6 | Connecticut | 15.3% |
7 | Vermont | 13.7% |
8 | Oregon | 13.5% |
9 | California | 13.0% |
10 | Texas | 12.9% |
11 | Oklahoma | 11.5% |
12 | South Dakota | 11.1% |
13 | Michigan | 11.0% |
13 | Nebraska | 11.0% |
15 | Georgia | 10.6% |
16 | Minnesota | 10.4% |
17 | Iowa | 10.3% |
18 | Alabama | 10.1% |
19 | Utah | 9.9% |
20 | Idaho | 9.5% |
20 | Massachusetts | 9.5% |
22 | Nevada | 8.9% |
23 | Arizona | 8.8% |
24 | Indiana | 8.6% |
25 | Mississippi | 8.1% |
26 | Washington | 8.0% |
27 | Colorado | 7.9% |
28 | Maine | 7.8% |
29 | Ohio | 7.7% |
30 | New Hampshire | 7.4% |
31 | Tennessee | 7.0% |
32 | South Carolina | 6.6% |
33 | Missouri | 6.3% |
34 | Maryland | 6.2% |
35 | Virginia | 6.0% |
36 | Delaware | 5.4% |
37 | North Carolina | 5.3% |
38 | Rhode Island | 5.2% |
39 | Hawaii | 4.8% |
40 | Florida | 4.6% |
40 | Montana | 4.6% |
42 | Louisiana | 4.4% |
43 | Wisconsin | 3.6% |
44 | New York | 3.2% |
45 | Arkansas | 2.7% |
46 | Kentucky | 2.6% |
47 | New Jersey | 1.0% |
47 | Pennsylvania | 1.0% |
49 | Illinois | 0.0% |
49 | Kansas | 0.0% |
Source: Tax Foundation
Note: The percentages for Michigan, North Carolina, Oklahoma and Wisconsin are from 2019, while the Georgia numbers come from 2018. The study’s calculations for the other states are based on 2020 data.


