Colorado Crop Progress and Condition Summary – May 14, 2018

© iStock - Pashalgnatov
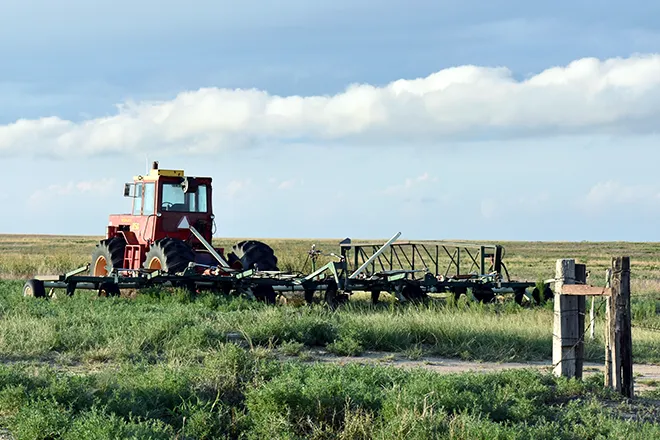
Hot and dry conditions accelerated fieldwork and planting activities last week, according to the Mountain Region Field Office of the National Agricultural Statistics Service, USDA. Precipitation late last week was mostly confined to northern and some eastern counties.
Northeastern county reporters observed damaging hail and isolated heavy rainfall, although moisture continued to improve dryland crop and rangeland conditions. In east central counties, those who haven’t received moisture noted the winter wheat was severely stressed. High winds were also reported.
Southwestern counties missed out on precipitation last week, and reporters noted conditions worsened. In Archuleta and La Plata counties, irrigation water was already shut off with reports of crop losses. Livestock producers continued to sell off due to drought. High winds and extreme fire danger were also reported.
In the San Luis Valley, no moisture was received and pastures were noted to be slow-growing. Hay supplies continued to shorten, and producers were feeding longer than expected. Fall potato planting really picked up last week and the majority of small grains planting was complete.
In southeastern counties, wheat aphid infestations were reported to be severe in areas, with producers swathing some wheat for forage in response.
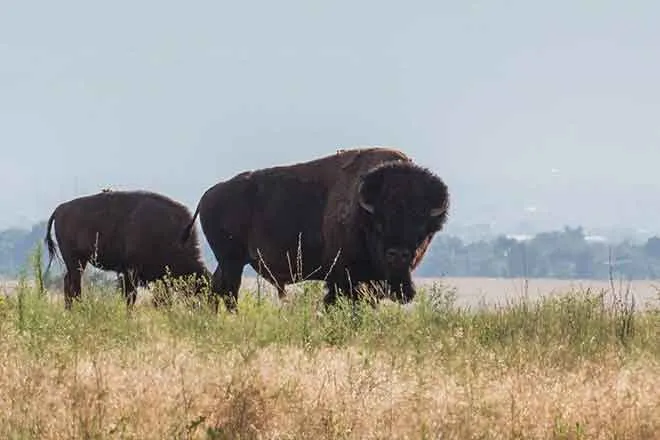
Statewide, calving and lambing were mostly complete.
As of May 14, 2018, snowpack in Colorado was 46 percent measured as percent of median snowfall. The Southwest and San Luis Valley were 7 and 1 percent, respectively.
Stored feed supplies were rated 9 percent very short, 20 percent short, 70 percent adequate, and 1 percent surplus.
Sheep death loss was 51 percent average and 49 percent light.
Cattle death loss was 81 percent average and 19 percent light.
CROP AND LIVESTOCK PROGRESS | ||||
Commodity | Current week | Previous week | Previous year | 5-year average |
(percent) | (percent) | (percent) | (percent) | |
Barley | ||||
Planted .............................................................. | 95 | 93 | 90 | 91 |
Emerged ............................................................ | 81 | 65 | 76 | 64 |
Corn | ||||
Planted .............................................................. | 41 | 16 | 50 | 51 |
Emerged ............................................................ | 7 | 1 | 14 | 11 |
Dry edible beans | ||||
Planted .............................................................. | 1 | NA | 4 | 4 |
Onions | ||||
Planted .............................................................. | 96 | 90 | 78 | 90 |
Potatoes inside San Luis Valley | ||||
Planted .............................................................. | 81 | 46 | 48 | 43 |
Potatoes outside San Luis Valley | ||||
Planted .............................................................. | 70 | 60 | 79 | 79 |
Emerged ............................................................ | 11 | 3 | 27 | 23 |
Spring wheat | ||||
Planted .............................................................. | 84 | 74 | 74 | 75 |
Emerged ............................................................ | 59 | 35 | 50 | 45 |
Sugarbeets | ||||
Planted .............................................................. | 90 | 75 | 86 | 82 |
Emerged ............................................................ | 39 | 18 | 42 | 38 |
Winter wheat | ||||
Jointed ............................................................... | 72 | 46 | 86 | 69 |
Headed .............................................................. | 11 | 1 | 18 | 16 |
Cattle and calves | ||||
Cows calved ...................................................... | 94 | 93 | 94 | 97 |
Sheep and lambs | ||||
Ewes lambed ..................................................... | 99 | 98 | 92 | 96 |
DAYS SUITABLE FOR FIELDWORK AND SOIL MOISTURE CONDITION | ||||
Current week | Previous week | Previous year | 5-year average | |
Days suitable for fieldwork .................................... | 6.1 | 4.8 | 4.1 | 4.8 |
Topsoil moisture | (percent) | (percent) | (percent) | (percent) |
Very short ......................................................... | 19 | 18 | 2 | 8 |
Short ................................................................. | 25 | 24 | 6 | 19 |
Adequate ........................................................... | 55 | 57 | 84 | 66 |
Surplus .............................................................. | 1 | 1 | 8 | 7 |
Subsoil moisture | ||||
Very short ......................................................... | 12 | 11 | 4 | 14 |
Short ................................................................. | 26 | 24 | 15 | 25 |
Adequate ........................................................... | 62 | 64 | 80 | 58 |
Surplus .............................................................. | -- | 1 | 1 | 3 |
CROP, LIVESTOCK, PASTURE AND RANGE CONDITION | ||||
Commodity | Current week | Previous week | Previous year | 5-year average |
(percent) | (percent) | (percent) | (percent) | |
Alfalfa hay | ||||
Very poor .......................................................... | 8 | 7 | -- | NA |
Poor ................................................................... | 9 | 9 | 4 | NA |
Fair .................................................................... | 27 | 29 | 27 | NA |
Good ................................................................. | 46 | 47 | 60 | NA |
Excellent ........................................................... | 10 | 8 | 9 | NA |
Barley | ||||
Very poor .......................................................... | 1 | NA | -- | 1 |
Poor ................................................................... | 3 | NA | -- | 1 |
Fair .................................................................... | 23 | NA | 13 | 25 |
Good ................................................................. | 52 | NA | 54 | 54 |
Excellent ........................................................... | 21 | NA | 33 | 19 |
Pasture and range | ||||
Very poor .......................................................... | 9 | 14 | 1 | 10 |
Poor ................................................................... | 20 | 24 | 3 | 16 |
Fair .................................................................... | 33 | 31 | 28 | 30 |
Good ................................................................. | 38 | 30 | 58 | 38 |
Excellent ........................................................... | -- | 1 | 10 | 6 |
Winter wheat | ||||
Very poor .......................................................... | 6 | 5 | 6 | 13 |
Poor ................................................................... | 12 | 12 | 14 | 15 |
Fair .................................................................... | 29 | 30 | 35 | 30 |
Good ................................................................. | 49 | 48 | 35 | 35 |
Excellent ........................................................... | 4 | 5 | 10 | 7 |
Livestock | ||||
Very poor .......................................................... | -- | -- | -- | -- |
Poor ................................................................... | 5 | 3 | 2 | 3 |
Fair .................................................................... | 16 | 13 | 16 | 21 |
Good ................................................................. | 71 | 79 | 74 | 68 |
Excellent ........................................................... | 8 | 5 | 8 | 8 |